

Question
StartupCo commenced operations at the beginning of 2020. $125 million of equity was raised to fund the purchase of equipment as well as for general
StartupCo commenced operations at the beginning of 2020. $125 million of equity was raised to fund the purchase of equipment as well as for general corporate purposes. As part of its business planning process, a 5-year forecast was developed (base case) as well as upside and downside scenarios (high and low cases, respectively). At the end of 2020, StartupCo issued $150 million of 5-year debt, repayable in equal annual installments at the end of each year, to finance its future capital program.
a) Using the base case, calculate net earnings for 2021E.
Answer Options are:
- $6,600
- $5,250
- $7,725
- $7,163
b) Using the low case, calculate total depreciation expense for the year 2025E.
Answer options are:
-$17,500
- $9,775
- $14,875
- $11,500
c) Using the high case, calculate the change in non-cash working capital in 2023E.
Answer options are:
- -$1,828
- -$141
- $141
- $1,828
Thanks so much in advance for answering these questions. A calculation would be highly appreciated.
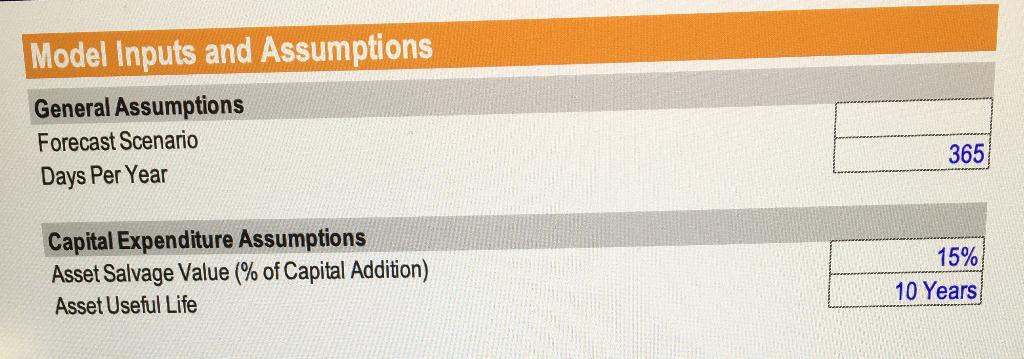
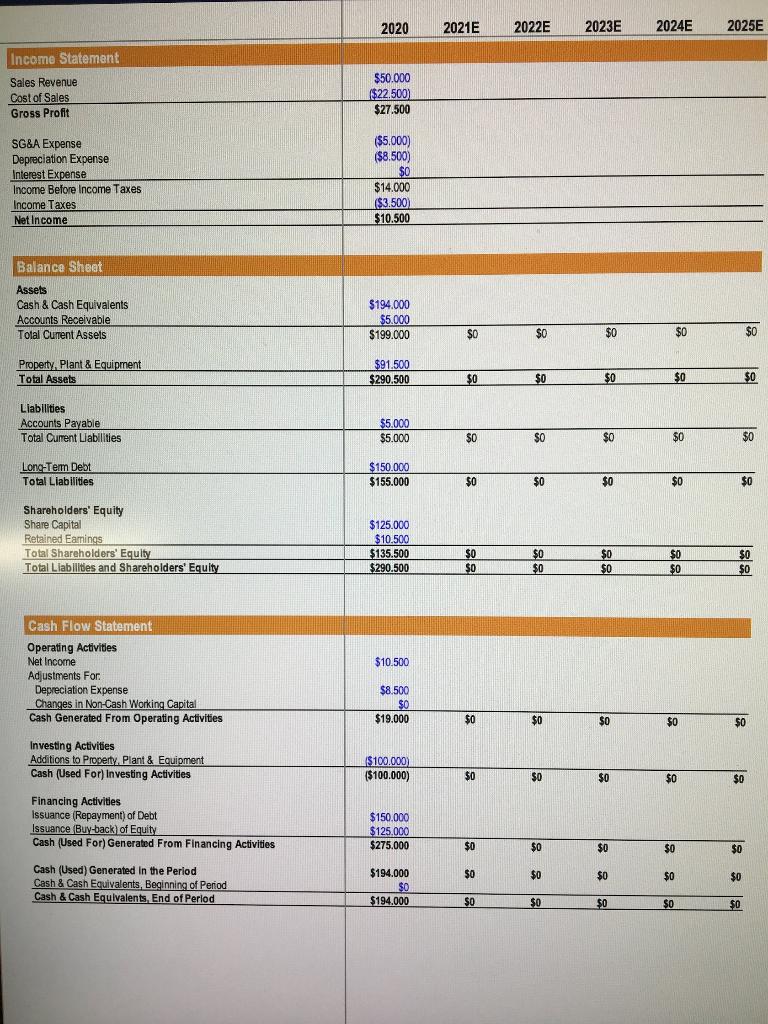
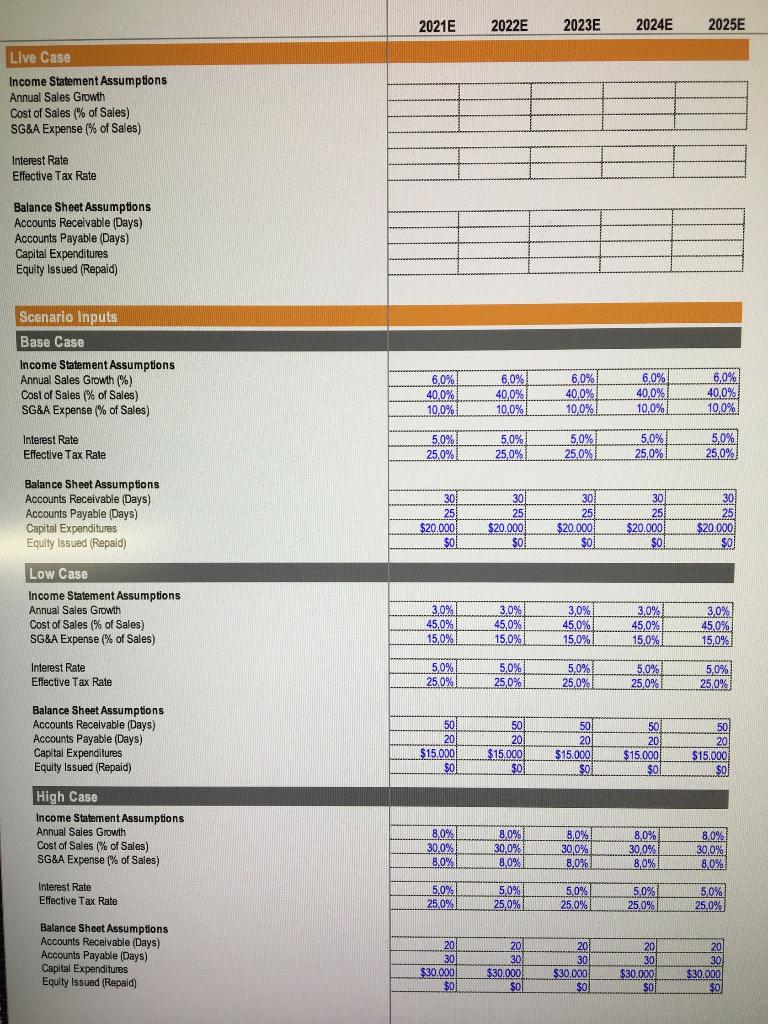
Model Inputs and Assumptions General Assumptions Forecast Scenario Days Per Year 365 Capital Expenditure Assumptions Asset Salvage Value (% of Capital Addition) Asset Useful Life 15% 10 Years 2020 2021E 2022E 2023E 2024E 2025E Income Statement Sales Revenue Cost of Sales Gross Profit $50.000 ($22.500) $27.500 SG&A Expense Depreciation Expense Interest Expense Income Before Income Taxes Income Taxes Net Income ($5,000) ($8.500) $0 $14.000 ($3.500) $10.500 Balance Sheet Assets Cash & Cash Equivalents Accounts Receivable Total Current Assets $194.000 $5.000 $199.000 SO $0 $0 $0 $0 Property. Plant & Equipment Total Assets $91.500 $290.500 $0 $0 $0 $0 $0 Liabilities Accounts Payable Total Current Liabilities $5.000 $5.000 $0 $0 $0 $0 $0 Long-Term Debt Total Liabilities $150.000 $155.000 $0 $0 $0 $0 $0 Shareholders' Equity Share Capital Retained Eamings Total Shareholders' Equity Total Liabilities and Shareholders' Equity $125.000 $10.500 $135.500 $290.500 $0 $0 $0 $0 $0 $0 $0 $0 $0 $0 $ $10.500 Cash Flow Statement Operating Activities Net Income Adjustments For Depreciation Expense Changes in Non-Cash Working Capital Cash Generated From Operating Activities $8.500 $0 $19.000 $0 $0 $0 $0 $0 Investing Activities Additions to Property Plant & Equipment Cash (Used For) Investing Activities $100.000) ($100.000) $0 $0 $0 $0 $0 Financing Activities Issuance (Repayment) of Debt Issuance Buy-back) of Equity Cash (Used For) Generated From Financing Activities $150.000 $125.000 $275.000 $0 $0 $0 $0 $0 $0 $0 $0 $0 $0 Cash (Used) Generated in the Period Cash & Cash Equivalents, Beginning of Period Cash & Cash Equivalents, End of Period $194.000 0 $0 $194.000 $0 $0 $0 $0 $0 2021E 2022E 2023E 2024E 2025E Live Case Income Statement Assumptions Annual Sales Growth Cost of Sales (% of Sales) SG&A Expense % of Sales) Interest Rate Effective Tax Rate Balance Sheet Assumptions Accounts Receivable (Days) Accounts Payable (Days) Capital Expenditures Equity Issued (Repaid) Scenario Inputs Base Case Income Statement Assumptions Annual Sales Growth (%) Cost of Sales (% of Sales) SG&A Expense (% of Sales) 6,0% 40.0% 6,0% 40,0%) 10,0% 6,0% 40,0% 10,0% 6,0% 40,0% 10,0% 6,0% 40.0% 10,0% 10.0% Interest Rate Effective Tax Rale 5,0% 25.0%) 5,0% 25,0% 5,0% 25,0% 5.0% 25,0% 5,0% 25.0% Balance Sheet Assumptions Accounts Receivable (Days) Accounts Payable (Days) Capital Expenditures Equity Issued (Repald) 301 25 $ $20.000 $0 30 25 $20.0001 $0 301 25 $20.000 $0 30 25 $20.000 $0! 30 25 $20.000 $0 Low Case Income Statement Assumptions Annual Sales Growth Cost of Sales (% of Sales) SG&A Expense (% of Sales) 3,0% 45,0% 15,0% 3,0% 45,0% 15,0% 3,0% 45,0% 15.0% 3,0% 45,0% 15.0% 3,0% 45,0% 15,0% Interest Rate Effective Tax Rate 5,0% 25,0% 5,0% 25,0% 5,0% 25,0% 5.0% 250% 5,0% 25,0% Balance Sheet Assumptions Accounts Receivable (Days) Accounts Payable (Days) Capital Expenditures Equity Issued (Repaid) 50 20 $15.000 $0) 501 20 $15.000 $0 50 20 $15.000! $0 501 20 $15.000 $0 50 20 $15.000 $0 High Case Income Statement Assumptions Annual Sales Growth Cost of Sales (% of Sales) SG&A Expense (% of Sales) 8.0% 30,0% 8,0% 8.0% 30.0% 8.0% 3,0% 30.0% 8,0% 8,0% 30.0% 8,0% 8,0% 30,0% 8,0% Interest Rate Effective Tax Rate 5.0% 25,0% 5.0% 25,0% 5,0% 250% 5.0% 25.0% 5,0% 25,0% Balance Sheet Assumptions Accounts Receivable (Days) Accounts Payable (Days) Capital Expenditures Equity Issued (Repaid) 201 30 $30.000 $0 2011 30 $30.000 $0 20 30 $30.000 $0 20 30 $30.000 $0 20 30 $30.000 $0Step by Step Solution
There are 3 Steps involved in it
Step: 1

Get Instant Access to Expert-Tailored Solutions
See step-by-step solutions with expert insights and AI powered tools for academic success
Step: 2

Step: 3
Ace Your Homework with AI
Get the answers you need in no time with our AI-driven, step-by-step assistance
Get Started
The Audit Is A Powerful Management Tool
Authors: Fateh Bouchene
1st Edition
6204366548, 978-6204366548