STAT_9B_Preview Score: 0/9 0/8 answered . Question 1 The 2020 November presidential election in the United States had one of the highest voter turnout rates
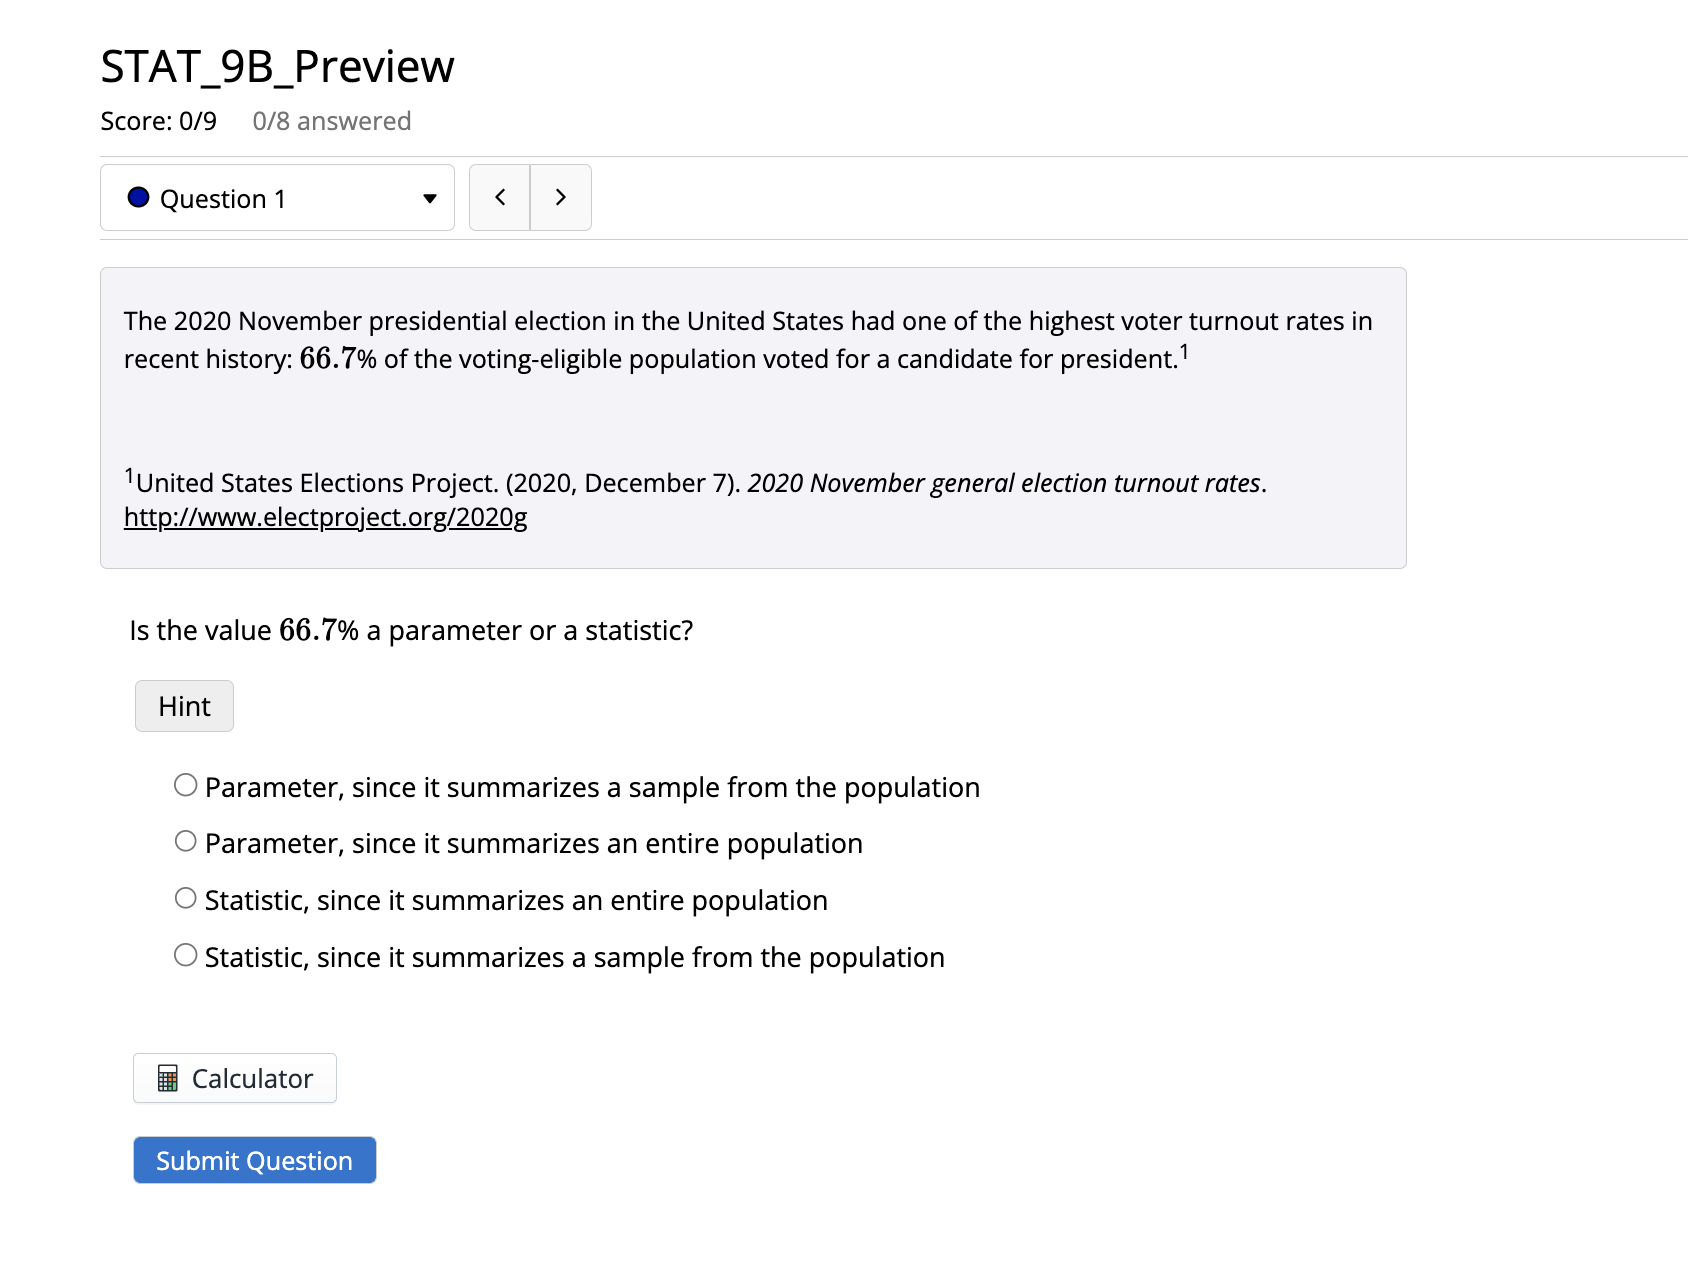
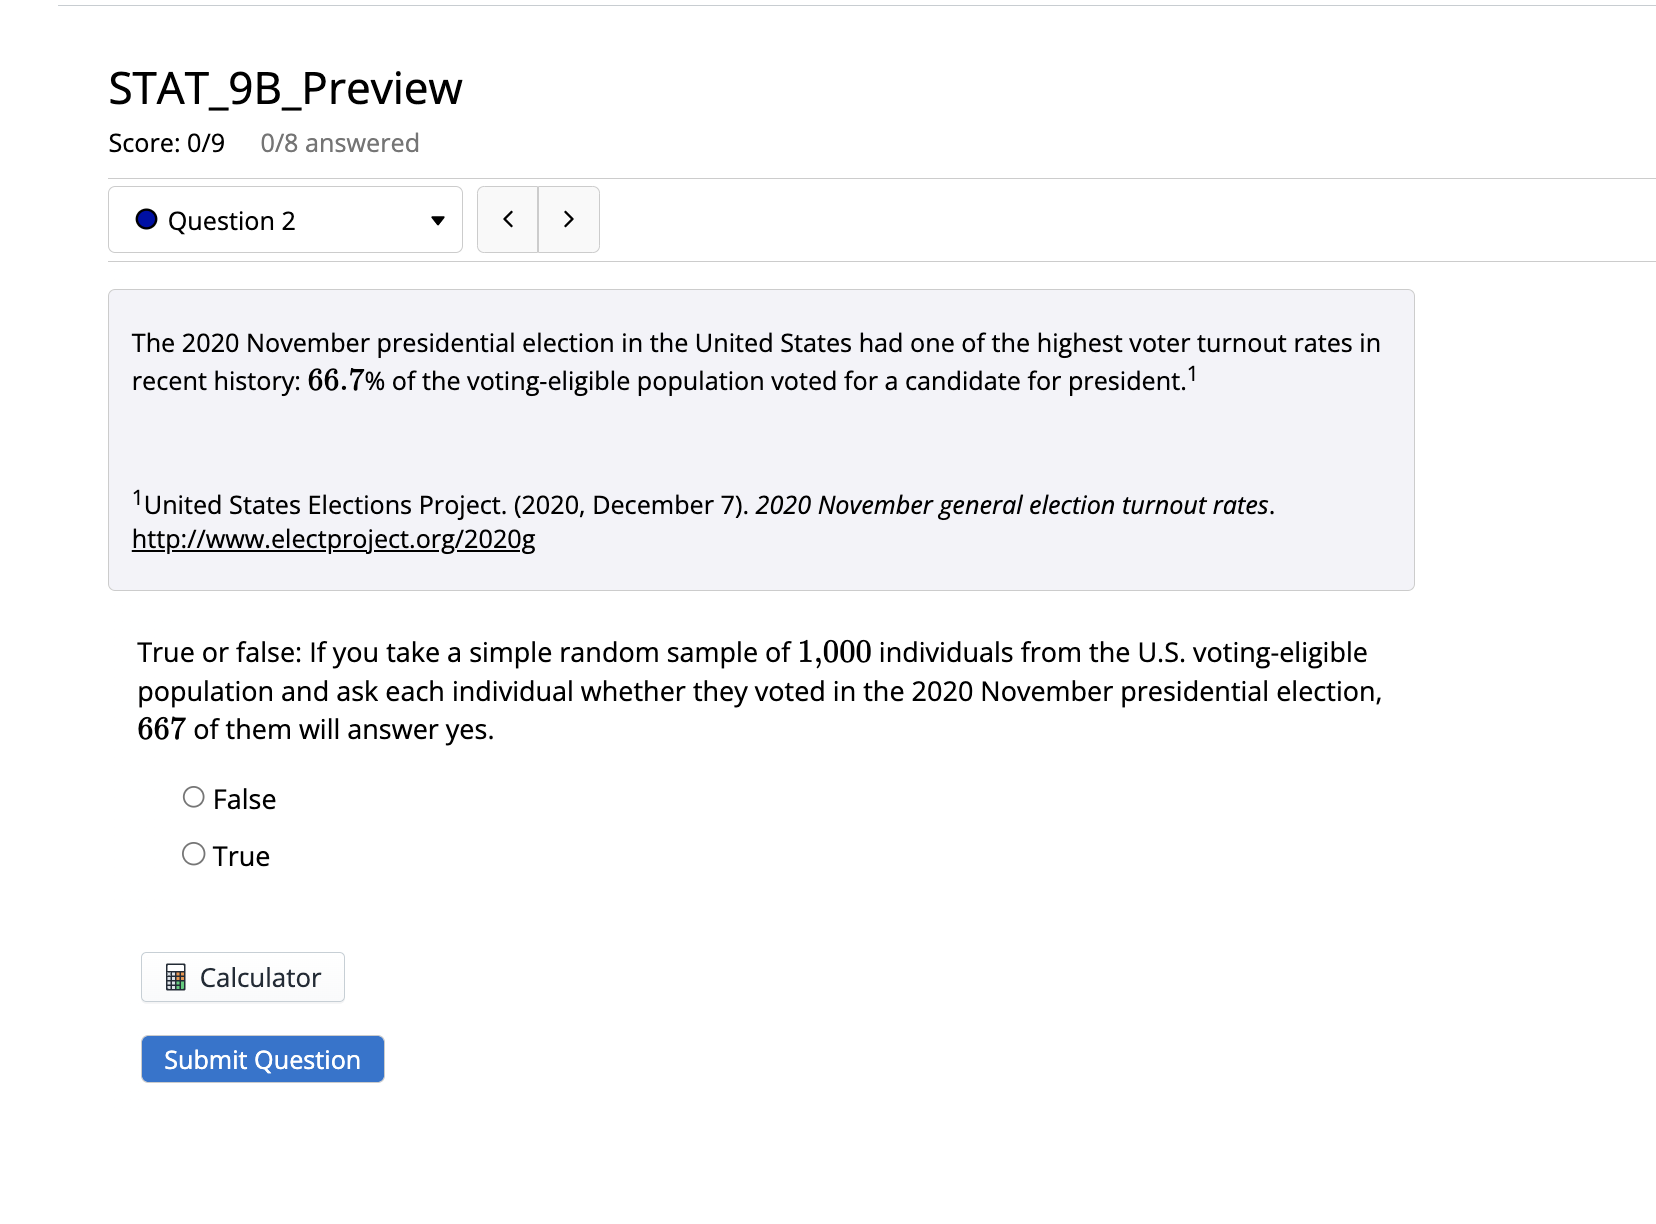
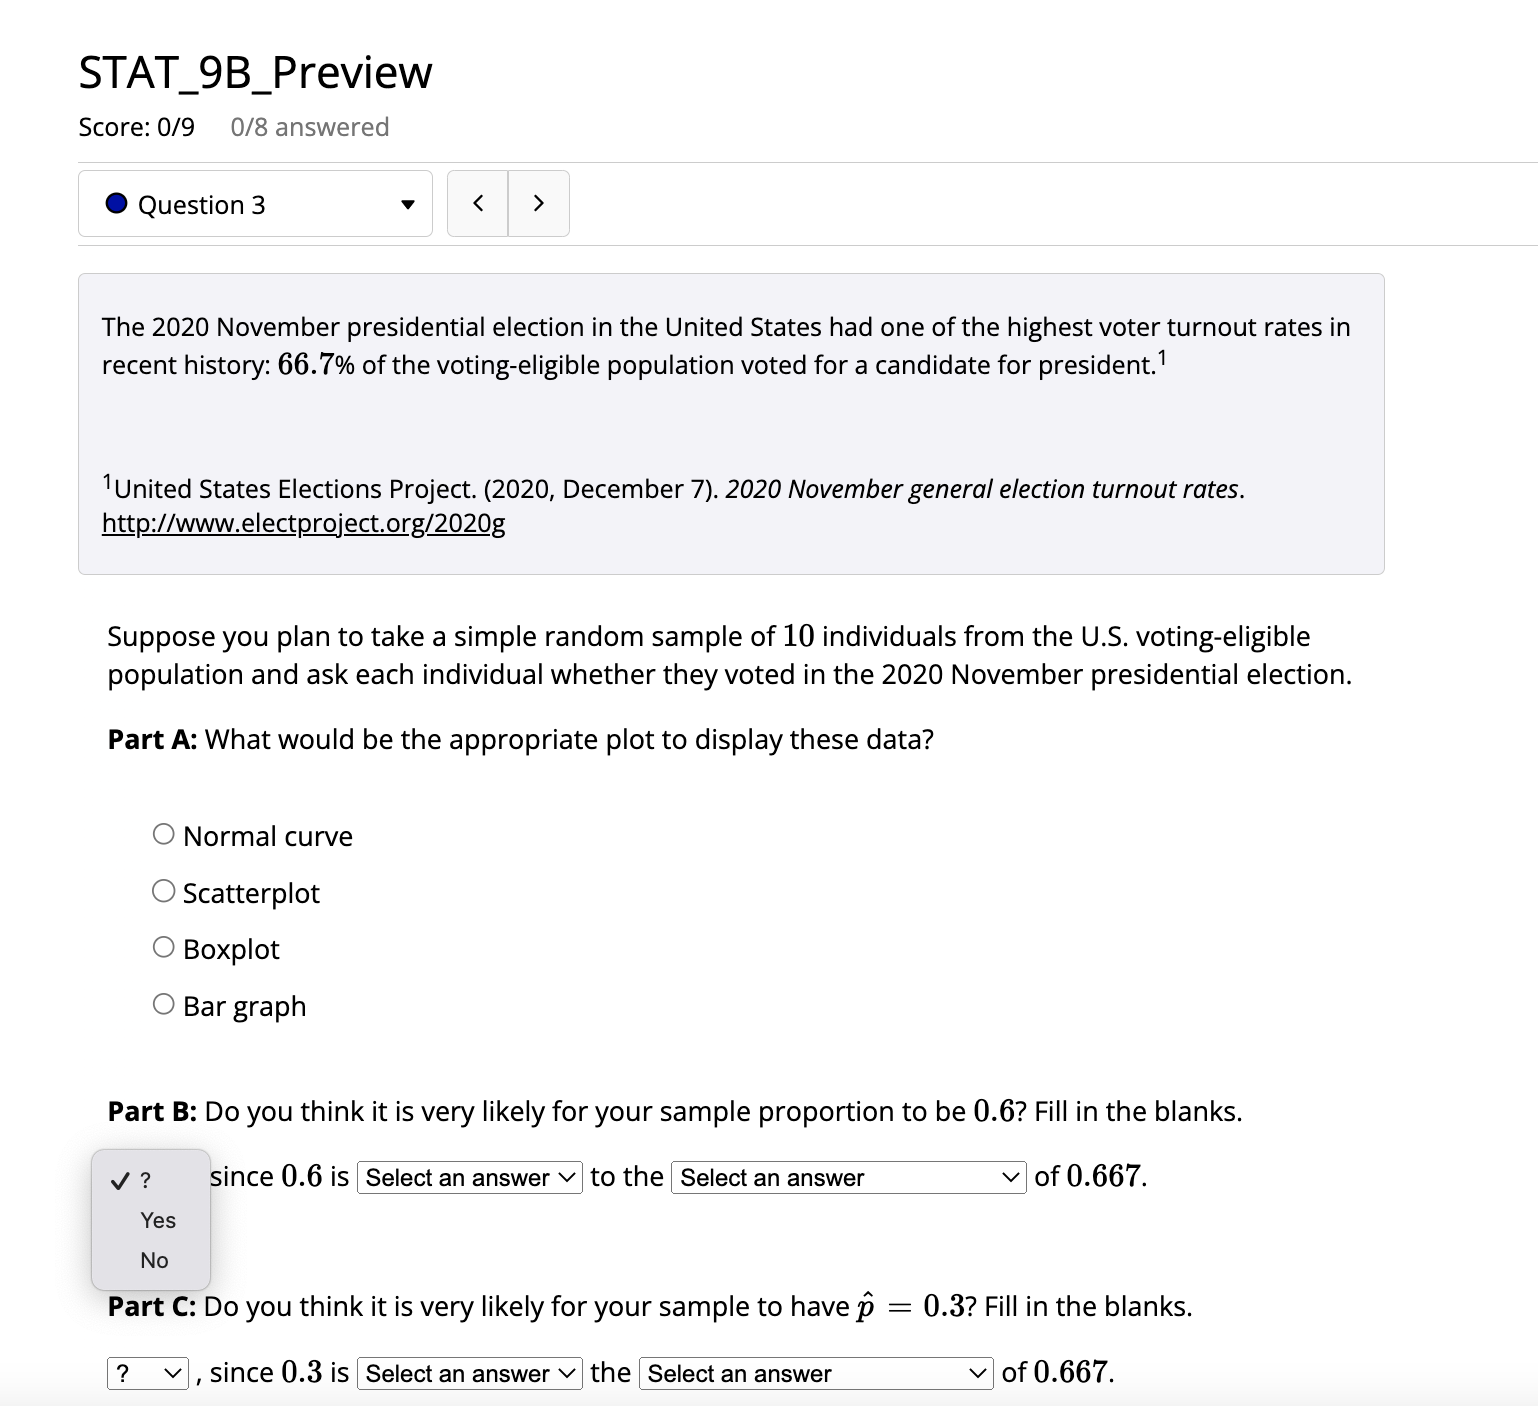
STAT_9B_Preview Score: 0/9 0/8 answered . Question 1 The 2020 November presidential election in the United States had one of the highest voter turnout rates in recent history: 66.7% of the voting-eligible population voted for a candidate for president. United States Elections Project. (2020, December 7). 2020 November general election turnout rates. http://www.electproject.org/2020g Is the value 66.7% a parameter or a statistic? Hint O Parameter, since it summarizes a sample from the population Parameter, since it summarizes an entire population O Statistic, since it summarizes an entire population O Statistic, since it summarizes a sample from the population Calculator Submit QuestionSTAT_9B_Preview Score: 0/9 0/8 answered . Question 2 The 2020 November presidential election in the United States had one of the highest voter turnout rates in recent history: 66.7% of the voting-eligible population voted for a candidate for president." "United States Elections Project. (2020, December 7). 2020 November general election turnout rates. http://www.electproject.org/2020g True or false: If you take a simple random sample of 1,000 individuals from the U.S. voting-eligible population and ask each individual whether they voted in the 2020 November presidential election, 667 of them will answer yes. O False O True Calculator Submit QuestionSTAT_9 B_P review Score: 0/9 0/8 answered 0 Question 3 v The 2020 November presidential election in the United States had one of the highest voter turnout rates in recent history: 66.7% of the voting-eligible population voted for a candidate for president.1 1United States Elections Project. (2020, December 7). 2020 Novembergeneral election turnout rates. h_ttp://www.electmjectbrg/ZOZOg Suppose you plan to take a simple random sample of 10 individuals from the US. voting-eligible population and ask each individual whether they voted in the 2020 November presidential election. Part A: What would be the appropriate plot to display these data? 0 Normal curve 0 Scatterplot O Boxplot 0 Bar graph Part B: Do you think it is very likely for your sample proportion to be 0.6? Fill in the blanks. '/ ? since 0.6 is to the I Select an answer VI of 0.667. Yes No Part C: Do you think it is very likely for your sample to have 13 = 0.3? Fill in the blanks. , since 0.3 is i Select an answer vIthe I Select an answer Vi Of 0.667. STAT_9 B_P review Score: 0/9 0/8 answered 0 Question 3 v The 2020 November presidential election in the United States had one of the highest voter turnout rates in recent history: 66.7% of the voting-eligible population voted for a candidate for president.1 1United States Elections Project. (2020, December 7). 2020 Novembergeneml election turnout rates. h_ttp://www.e|ectpjectorg/ZOZOg Suppose you plan to take a simple random sample of 10 individuals from the U.S. voting-eligible population and ask each individual whether they voted in the 2020 November presidential election. Part A: What would be the appropriate plot to display these data? 0 Normal curve 0 Scatterplot O Boxplot 0 Bar graph Part B: Do you think it is very likely for your sample proportion to be 0.6? Fill in the blanks. ? V , since 0.6 i: J Select an answer 0 the I Select an answer Vi of 0.667. fairly close not close at all Part C: Do you think it is very likely for your sample to have : 0.3? Fill in the blanks. -, since 0.3 is i Select an answer Vi the i Select an answer Vi of 0.667. STAT_9 B_Preview Score: 0/9 0/8 answered 0 Question 3 v The 2020 November presidential election in the United States had one of the highest voter turnout rates in recent history: 66.7% ofthe votingeligible population voted for a candidate for president.1 1United States Elections Project. (2020, December 7). 2020 Novembergeneral election turnout rates. http://www.electproject.org/2020g Suppose you plan to take a simple random sample of 10 individuals from the US. voting-eligible population and ask each individual whether they voted in the 2020 November presidential election. Part A: What would be the appropriate plot to display these data? 0 Normal curve 0 Scatterplot O Boxplot 0 Bar graph Part B: Do you think it is very likely for your sample proportion to be 0.6? Fill in the blanks. -. Since 0-6 is to thf J Select an answer If 0.667. population mean population proportion Part C: Do you think it is very likely for your PDPUIEtiO\" Standard dEViath\" the blanks. -, since 0.3 is l Select an answer Vlthe l Select an answer VI of 0.667. Part B: Do you think it is very likely for your sample proportion to be 0.6? Fill in the blanks. ? v, since 0.6 is Select an answer v to the Select an answer of 0.667. Part C: Do you think it is very likely for your sample to have p = 0.3? Fill in the blanks. ? , since 0.3 is Select an answer v the Select an answer of 0.667. Hint p represents the population proportion, whereas p is the notation for a sample proportion Calculator Submit QuestionSTAT_9 B_P review Score: 0/9 0/8 answered 0 Question 4 v Go to the DCMP Sampling Distribution of the Sample Proportion tool at h_ttps://dcmathpathways.shinyggps.io/SampDist Prom :. You will use this tool to simulate taking random samples of 10 individuals from the U.S. voting-eligible population: 0 Set the Population Proportion to p = 0.67. - Set the Sample Size to \"n, = 10. - Simulate taking 1,000 random samples of size 10 by selecting "1,000" and clicking "Draw Sample(s)." The \"Sampling Distribution of Sample Proportion" graph at the bottom of the tool displays the distribution of the 1,000 sample proportions from your random samples. Use the \"Sampling Distribution of Sample Proportion" graph to approximate the proportion of the simulated samples with 0.6. E Calculator Submit Question STAT_9 B_Preview Score: 019 0/8 answered 0 Question 5 V Use the bar above 13 : 0.5 on the "Sampling Distribution of Sample Proportion" graph to complete the following sentence: In a sample of 10 individuals, if the sample proportion that voted in the 2020 November presidential election is 0.5, how many individuals voted in the 2020 November presidential election? For a sample of 10 individuals from the U.S. voting-eligible population, the approximate probability that exactly individuals in the sample voted in the 2020 November presidential election is E Calculator Submit Question STAT_9B_Preview Score: 0/9 0/8 answered Question 6 The standard deviation of simulated sample proportions should be close to 0.15. Which of the following is a correct interpretation of this value? Hint The standard deviation of a variable is the amount by which we might expect a typical value of this variable to fall from its mean--the standard deviation from the mean. In this context, the variable is the sample proportion of individuals who voted in the 2020 November presidential election in a sample of size 10. . All sample proportions of individuals who voted in the 2020 November presidential election in random samples of size 10 will be 0.15 away from 0.67. O We would expect a typical sample proportion of individuals who voted in the 2020 November presidential election in a random sample of size 10 to be about 0.15 away from 0.67. O About 50% of sample proportions of individuals who voted in the 2020 November presidential election in random samples of size 10 will be between 0.52 and 0.82. We would expect a typical sample proportion of individuals who voted in the 2020 November presidential election to be around 0.15. Calculator Submit QuestionSTAT_9 B_Preview Score: 0/9 0/8 answered 0 Question 7 v Rather than using simulation, we can use mathematical theory to derive expressions for the mean and standard deviation of the sampling distribution of the sample proportion. Keep these properties in mind as you answer the remaining questions in this preview assignment. Sampling Distribution of the Sample Proportion When taking many random samples of size n from a population distribution with population proportion p: 0 The mean of the distribution of sample proportions is p. 0 The standard deviation of the distribution of sample proportions is Use a formula to calculate the standard deviation of sample proportions when taking random samples of size 10 from a population where 0.67. Round to four decimal places. Your answer should be close to the standard deviation of sample proportions in your simulation E Calculator Submit
Step by Step Solution
There are 3 Steps involved in it
Step: 1
Get Instant Access to Expert-Tailored Solutions
See step-by-step solutions with expert insights and AI powered tools for academic success
Step: 2
Step: 3
Ace Your Homework with AI
Get the answers you need in no time with our AI-driven, step-by-step assistance