

Answered step by step
Verified Expert Solution
Question
1 Approved Answer
Stata TARLE I Fraction of G&T Students from Each Race Group, Full Sample (1) (2) (3) DV = Fraction of G-T Students Who Are: White
Stata
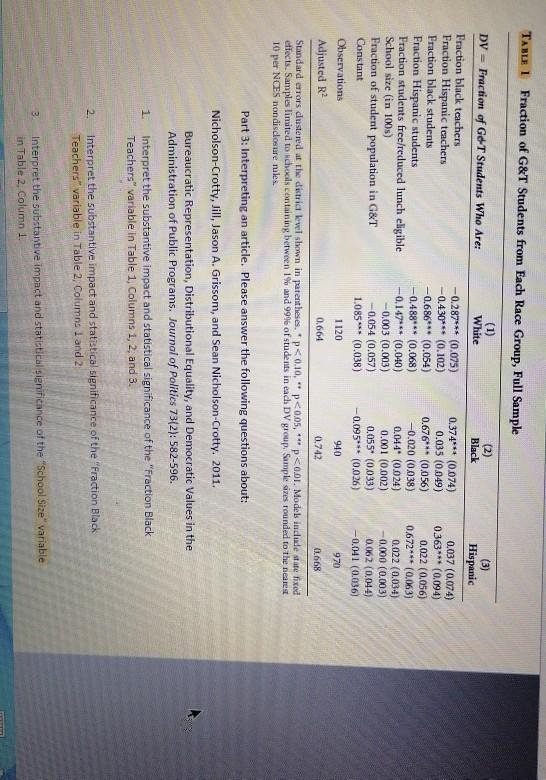
TARLE I Fraction of G&T Students from Each Race Group, Full Sample (1) (2) (3) DV = Fraction of G-T Students Who Are: White Black Hispanic Fraction black teachers -0.287*** (0.075) 0.374*** (0.074) 0.037 (0.074) Fraction Hispanic tcachers -0.430*** (0.102) 0.035 (0.049) 0363*** (0.094) Praction black students -0.686*** (0.054) 0.676*** (0.056) 0.022 (0.056) Fraction Hispanic students -0.488 (0.068) -0.020 (0.038) 0672*** (0.063) Fraction students free/reduced lunch eligible -0.147*** (0.040) 0.044" (0.024) 0.022 (0.034) School size (in 100s) -0.003 (0.003) 0.001 (0.002) -0.000 (0.003) Praction of student population in G&T -0.054 (0.057) 0.055* (0,033) 0.062 (0.044) Constant 1.085*** (0.038) -0.095*** (0.026) -0.041 (0.036) Observations 1120 940 970 Adjusted R2 0.664 0.742 0.668 Standard errors clustered at the distria level shown in patentheses. PStep by Step Solution
There are 3 Steps involved in it
Step: 1

Get Instant Access to Expert-Tailored Solutions
See step-by-step solutions with expert insights and AI powered tools for academic success
Step: 2

Step: 3
Ace Your Homework with AI
Get the answers you need in no time with our AI-driven, step-by-step assistance
Get Started
Survey of Accounting
Authors: Thomas P. Edmonds, Frances M. McNair, Philip R. Olds, Bor Yi
3rd Edition
978-1259683794, 77490835, 1259683796, 9780077490836, 978-0078110856