

Answered step by step
Verified Expert Solution
Question
1 Approved Answer
State: fill in the Gray blanks and let me know what equation I need to use. Make a pivot table and a chart. Produit vine
State: fill in the Gray blanks and let me know what equation I need to use. Make a pivot table and a chart. 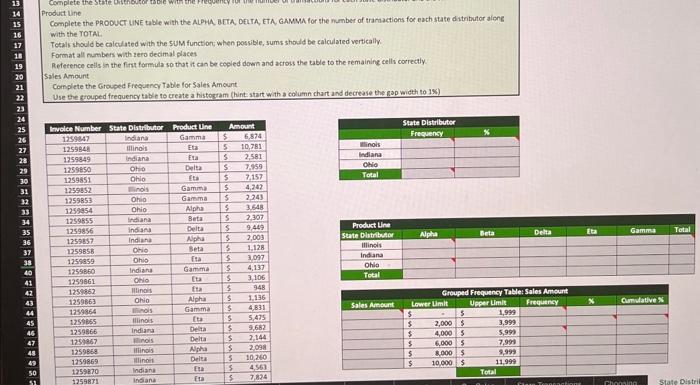
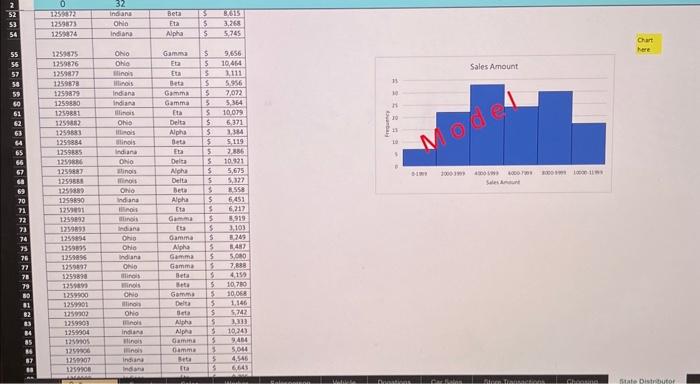
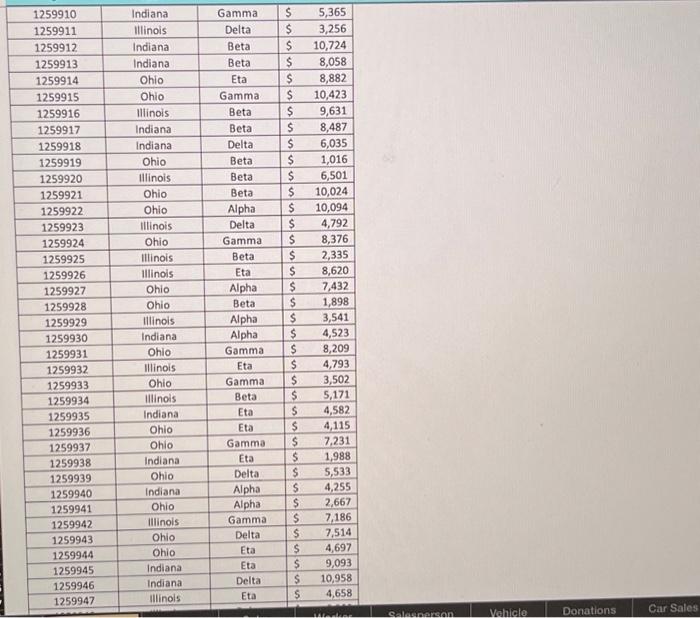
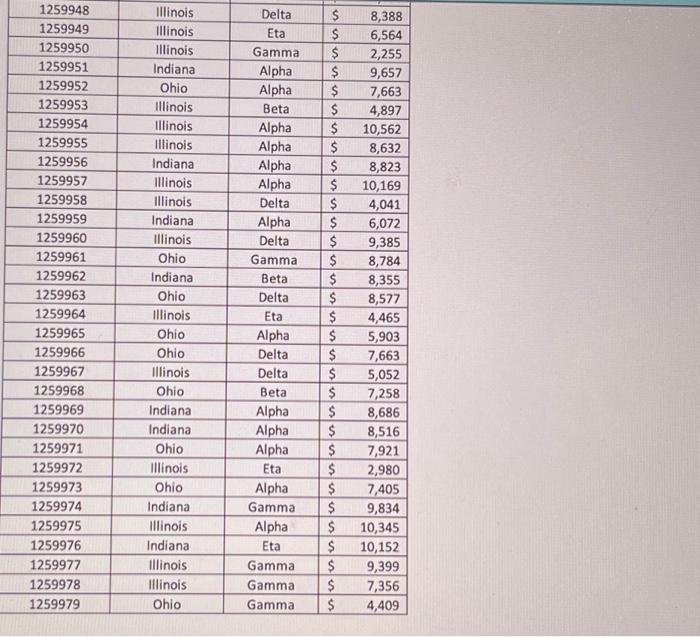 Produit vine Complete the PRODJET LNE table with the ALPHA. BCTA. DFLTA. ETA. GAMMM for the number of tranaations for each state distributor alenE with the TOTAL Tetals should becalculated with the SLM functiof; when possible, sums should be calculated vertically Forthat all numbers with zero decimal places Reference cells in the first formila so that it can be cepied down and across the table to the remaining cells correctly Sales Amount Complete the Grouped Frecuency Table for Sales Ameunt Use the gupuped frequency table to create a historiam (hint start with a column chart and decrease the gap width to as) \begin{tabular}{|c|c|c|cr|} \hline 1259948 & Illinois & Delta & $ & 8,388 \\ \hline 1259949 & Illinois & Eta & $ & 6,564 \\ \hline 1259950 & Illinois & Gamma & $ & 2,255 \\ \hline 1259951 & Indiana & Alpha & $ & 9,657 \\ \hline 1259952 & Ohio & Alpha & $ & 7,663 \\ \hline 1259953 & Illinois & Beta & $ & 4,897 \\ \hline 1259954 & Illinois & Alpha & $ & 10,562 \\ \hline 1259955 & Illinois & Alpha & $ & 8,632 \\ \hline 1259956 & Indiana & Alpha & $ & 8,823 \\ \hline 1259957 & Illinois & Alpha & $ & 10,169 \\ \hline 1259958 & Illinois & Delta & $ & 4,041 \\ \hline 1259959 & Indiana & Alpha & $ & 6,072 \\ \hline 1259960 & Illinois & Delta & $ & 9,385 \\ \hline 1259961 & Ohio & Gamma & $ & 8,784 \\ \hline 1259962 & Indiana & Beta & $ & 8,355 \\ \hline 1259963 & Ohio & Delta & $ & 8,577 \\ \hline 1259964 & Illinois & Eta & $ & 4,465 \\ \hline 1259965 & Ohio & Alpha & $ & 5,903 \\ \hline 1259966 & Ohio & Delta & $ & 7,663 \\ \hline 1259967 & Illinois & Delta & $ & 5,052 \\ \hline 1259968 & Ohio & Beta & $ & 7,258 \\ \hline 1259969 & Indiana & Alpha & $ & 8,686 \\ \hline 1259970 & Indiana & Alpha & $ & 8,516 \\ \hline 1259971 & Ohio & Alpha & $ & 7,921 \\ \hline 1259972 & Illinois & Eta & $ & 2,980 \\ \hline 1259973 & Ohio & Alpha & $ & 7,405 \\ \hline 1259974 & Indiana & Gamma & $ & 9,834 \\ \hline 1259975 & Illinois & Alpha & $ & 10,345 \\ \hline 1259976 & Indiana & Eta & $ & 10,152 \\ \hline 1259977 & Illinois & Gamma & $ & 9,399 \\ \hline 1259978 & Illinois & Gamma & $ & 7,356 \\ \hline 12599,409 \\ \hline \end{tabular} Produit vine Complete the PRODJET LNE table with the ALPHA. BCTA. DFLTA. ETA. GAMMM for the number of tranaations for each state distributor alenE with the TOTAL Tetals should becalculated with the SLM functiof; when possible, sums should be calculated vertically Forthat all numbers with zero decimal places Reference cells in the first formila so that it can be cepied down and across the table to the remaining cells correctly Sales Amount Complete the Grouped Frecuency Table for Sales Ameunt Use the gupuped frequency table to create a historiam (hint start with a column chart and decrease the gap width to as) \begin{tabular}{|c|c|c|cr|} \hline 1259948 & Illinois & Delta & $ & 8,388 \\ \hline 1259949 & Illinois & Eta & $ & 6,564 \\ \hline 1259950 & Illinois & Gamma & $ & 2,255 \\ \hline 1259951 & Indiana & Alpha & $ & 9,657 \\ \hline 1259952 & Ohio & Alpha & $ & 7,663 \\ \hline 1259953 & Illinois & Beta & $ & 4,897 \\ \hline 1259954 & Illinois & Alpha & $ & 10,562 \\ \hline 1259955 & Illinois & Alpha & $ & 8,632 \\ \hline 1259956 & Indiana & Alpha & $ & 8,823 \\ \hline 1259957 & Illinois & Alpha & $ & 10,169 \\ \hline 1259958 & Illinois & Delta & $ & 4,041 \\ \hline 1259959 & Indiana & Alpha & $ & 6,072 \\ \hline 1259960 & Illinois & Delta & $ & 9,385 \\ \hline 1259961 & Ohio & Gamma & $ & 8,784 \\ \hline 1259962 & Indiana & Beta & $ & 8,355 \\ \hline 1259963 & Ohio & Delta & $ & 8,577 \\ \hline 1259964 & Illinois & Eta & $ & 4,465 \\ \hline 1259965 & Ohio & Alpha & $ & 5,903 \\ \hline 1259966 & Ohio & Delta & $ & 7,663 \\ \hline 1259967 & Illinois & Delta & $ & 5,052 \\ \hline 1259968 & Ohio & Beta & $ & 7,258 \\ \hline 1259969 & Indiana & Alpha & $ & 8,686 \\ \hline 1259970 & Indiana & Alpha & $ & 8,516 \\ \hline 1259971 & Ohio & Alpha & $ & 7,921 \\ \hline 1259972 & Illinois & Eta & $ & 2,980 \\ \hline 1259973 & Ohio & Alpha & $ & 7,405 \\ \hline 1259974 & Indiana & Gamma & $ & 9,834 \\ \hline 1259975 & Illinois & Alpha & $ & 10,345 \\ \hline 1259976 & Indiana & Eta & $ & 10,152 \\ \hline 1259977 & Illinois & Gamma & $ & 9,399 \\ \hline 1259978 & Illinois & Gamma & $ & 7,356 \\ \hline 12599,409 \\ \hline \end{tabular}
State: fill in the Gray blanks and let me know what equation I need to use. Make a pivot table and a chart.
Step by Step Solution
There are 3 Steps involved in it
Step: 1

Get Instant Access to Expert-Tailored Solutions
See step-by-step solutions with expert insights and AI powered tools for academic success
Step: 2

Step: 3
Ace Your Homework with AI
Get the answers you need in no time with our AI-driven, step-by-step assistance
Get Started
Private Equity Investing In Emerging Markets Opportunities For Value Creation
Authors: R. Leeds
1st Edition
1137435348,1137435356