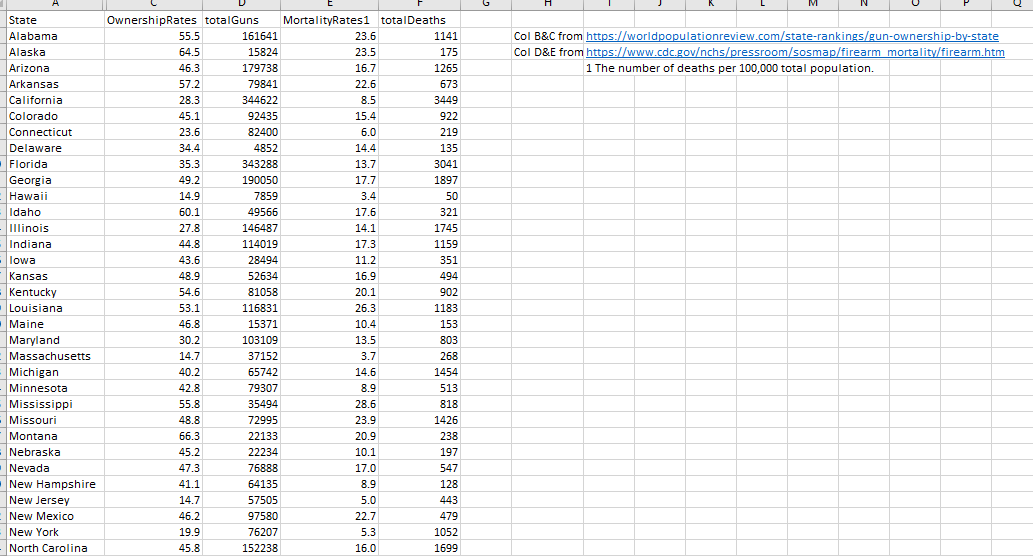
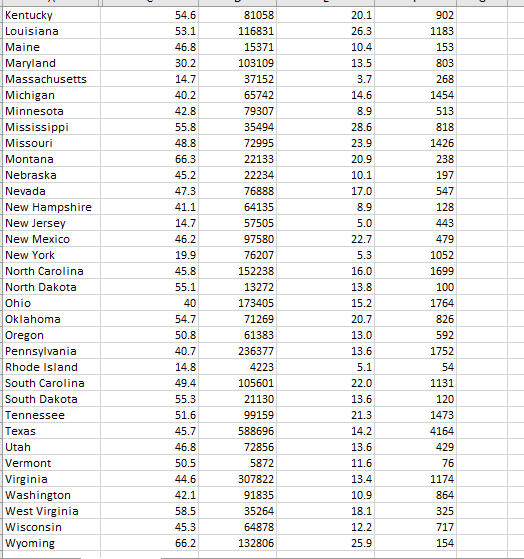
State OwnershipRates totalGuns MortalityRates1 totalDeaths Alabama 55.5 161641 23.6 1141 Col B&C from https://worldpopulationreview.com/state-rankings/gun-ownership-by-state Alaska 64.5 15824 23.5 175 Col D&E from https://www.cdc.govchs/pressroom/sosmap/firearm mortality/firearm.htm Arizona
State OwnershipRates totalGuns MortalityRates1 totalDeaths Alabama 55.5 161641 23.6 1141 Col B&C from https://worldpopulationreview.com/state-rankings/gun-ownership-by-state Alaska 64.5 15824 23.5 175 Col D&E from https://www.cdc.govchs/pressroom/sosmap/firearm mortality/firearm.htm Arizona 46.3 179738 16.7 1265 1 The number of deaths per 100,000 total population. Arkansas 57.2 79841 22.6 673 California 28.3 344622 8.5 3449 Colorado 45.1 92435 15.4 922 Connecticut 23.6 82400 6.0 219 Delaware 34.4 4852 14.4 135 Florida 35.3 343288 13.7 3041 Georgia 49.2 190050 17.7 1897 Hawaii 14.9 7859 3.4 50 Idaho 60.1 49566 17.6 321 Illinois 27.8 146487 14.1 1745 Indiana 44.8 114019 17.3 1159 lowa 43.6 28494 11.2 351 Kansas 48.9 52634 16.9 494 Kentucky 54.6 81058 20.1 902 Louisiana 53.1 116831 26.3 1183 Maine 46.8 15371 10.4 153 Maryland 30.2 103109 13.5 803 Massachusetts 14.7 37152 3.7 268 Michigan 40.2 65742 14.6 1454 Minnesota 42.8 79307 8.9 513 Mississippi 55.8 35494 28.6 818 Missouri 48.8 72995 23.9 1426 Montana 66.3 22133 20.9 238 Nebraska 45.2 22234 10.1 197 Nevada 47.3 76888 17.0 547 New Hampshire 41.1 64135 8.9 128 New Jersey 14.7 57505 5.0 443 New Mexico 46.2 97580 22.7 479 New York 19.9 76207 5.3 1052 North Carolina 45.8 152238 16.0 1699Kentucky 54.6 81058 20.1 902 Louisiana 53.1 116831 26.3 1183 Maine 46.8 15371 10.4 153 Maryland 30.2 103109 13.5 803 Massachusetts 14.7 37152 3.7 268 Michigan 40.2 65742 14.6 1454 Minnesota 42.8 79307 8.9 513 Mississippi 55.8 35494 28.6 818 Missouri 48.8 72995 23.9 1426 Montana 66.3 22133 20.9 238 Nebraska 45.2 22234 10.1 197 Nevada 47.3 76888 17.0 547 New Hampshire 41.1 64135 8.9 128 New Jersey 14.7 57505 5.0 443 New Mexico 46.2 97580 22.7 479 New York 19.9 76207 5.3 1052 North Carolina 45.8 152238 16.0 1699 North Dakota 55.1 13272 13.8 100 Ohio 40 173405 15.2 1764 Oklahoma 54.7 71269 20.7 826 Oregon 50.8 61383 13.0 592 Pennsylvania 40.7 236377 13.6 1752 Rhode Island 14.8 4223 5.1 54 South Carolina 49.4 105601 22.0 1131 South Dakota 55.3 21130 13.6 120 Tennessee 51.6 99159 21.3 1473 Texas 45.7 588696 14.2 4164 Utah 46.8 72856 13.6 429 Vermont 50.5 5872 11.6 76 Virginia 44.6 307822 13.4 1174 Washington 42.1 91835 10.9 864 West Virginia 58.5 35264 18.1 325 Wisconsin 45.3 64878 12.2 717 Wyoming 66.2 132806 25.9 154Include descriptive statistics for your x-variable (explanatory variable). Include the mean, M3 Correlation Project Instructions median, range, standard deviation. This "Instructions" doc provides detailed instructions for the Correlation assignment. Please complete Right below the summary measures table, analyze the descriptive measures. Don't just the assignment on the other document. repeat the numbers-actually interpret what you find. Translate any description- don't just say, "The mean is 18." Always remind the reader what the question was that the data are Purpose: referring to. For example, if I were looking at study time for my x variable I may say, "The A correlation study is a type of research method in which a researcher measures two variables to mean study time of my sample was 18 hours per week. The range was 15 hours, so there understand and assess the statistical relationship between them. If a linear relationship exists, then was a lot of variation in time spent studying " see how this interpretation give so much linear models can be used to make predictions. The purpose of this project is to complete a correlation more? study and write a report summarizing the findings. Provide a histogram or boxplot for your explanatory variable. Make sure you label and title your graph. Important: Right below the graph, interpret the shape of the graph. Is it Assignment Goal: normally distributed? Do there appear to be any outliers? Collect, summarize and analyze a data set to determine if there is a linear relationship between two quantitative variables, then draw conclusions that are supported by this analysis. Create a 2. Response variable: report explaining your findings. . Include descriptive statistics for your y-variable (response variable). Include the mean, median, range, standard deviation. Data to use for the assignment: Right below the summary measures table, analyze the descriptive measures (don't just choose one of these topics: repeat the numbers-actually interpret what you find). See my comment above for how to Gun ownership and Gun deaths (use Gun dataset. Use "rates" columns C and E) make the analysis meaningful. Waist size and BMI (use Body dataset) Provide a histogram or boxplot for your explanatory variable. Make sure you label and title your graph. Important: Right below the graph, interpret the shape of the graph. Is it Formatting for the assignment: normally distributed? Do there appear to be any outliers?. Part I: Introduction: a. Summarize the purpose of this project. What topic did you choose? Part IV: Correlation Analysis b. State your hypothesis about the linear relationship you will be investigating. Do you believe So now we get to the heart and soul of the correlation analysis! You'll answer, Is there a linear there will be a negative, positive, or no correlation between the variables? relationship between my (x) and my (y) variables? Identify your x and y variables. Which is the explanatory and which is the response variable? Generate a Scatterplot Part II: Data Collection Generate a scatterplot graphic to determine if we can "see" a relationship between your x and y I've created two different spreadsheets in Excel. Use one column for the x variable and a second variable. This is called "eyeballing" the variables and is the first thing statisticians always do to column for the y variable. All the columns have headings, so you'll need to determine the correct x get a feel for the data. and y variables from the dataset. (Email me if you are not sure and want to double check that you are choosing the correct variables) To generate a scatterplot: In StatCrunch, click on Graphics tab > Scatterplot, and click on the columns for the x and y variable columns. Click on Create Graphic for the scatter plot. What was the source of your data? For Gun data-see column H for links were the data came from. IMPORTANT: Be sure you don't mix up the explanatory and response variable. Label the graphic. For Body data, this was a hypothetical dataset taken from a textbook. If you chose "body data," explore websites/resources where you can find "for real" body data and share those. Please cite Analysis: Tell me what you see. Looking at this visual graphic does there APPEAR to be a linear any sources used per APA guidelines. correlation, or a relationship between your x and y variable? What was your sample size? (How many rows are there with data?) Discuss possible sources of Calculating the Correlation Coefficient: sample bias. Why? . Using Statcrunch: Go to State Regression > Simple Linear. Click on the columns for your x and y variables. (Again, don't turn these x and y variables around!!)- Part Ill: Descriptive statistics for x and y. Note that you'll need to generate mean and so values for the x and y variable to run this part of Use StatCrunch to calculate the descriptive statistics for the explanatory variable and the response the analysis. variable. To import the data from your Excel spreadsheet into Statcrunch, go into Statcrunch, then click Important: Be sure to click on "predicted value" at the bottom when setting this up. Choose a on the Data tab > Load > From File > On my computer. (locate your Excel doc). Once the data is value for the explanatory variable within the scope of data. This will give you the best predicted imported, "save" the dataset in StatCrunch. It will then be available whenever you want to use it. value, which you'll need for one of the questions below. Click Compute. 1. Explanatory variable
Step by Step Solution
There are 3 Steps involved in it
Step: 1
Get Instant Access to Expert-Tailored Solutions
See step-by-step solutions with expert insights and AI powered tools for academic success
Step: 2
Step: 3
Ace Your Homework with AI
Get the answers you need in no time with our AI-driven, step-by-step assistance