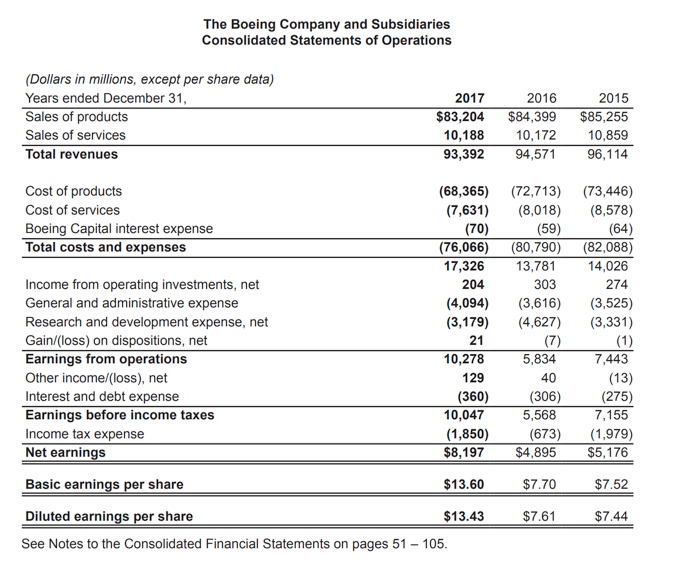
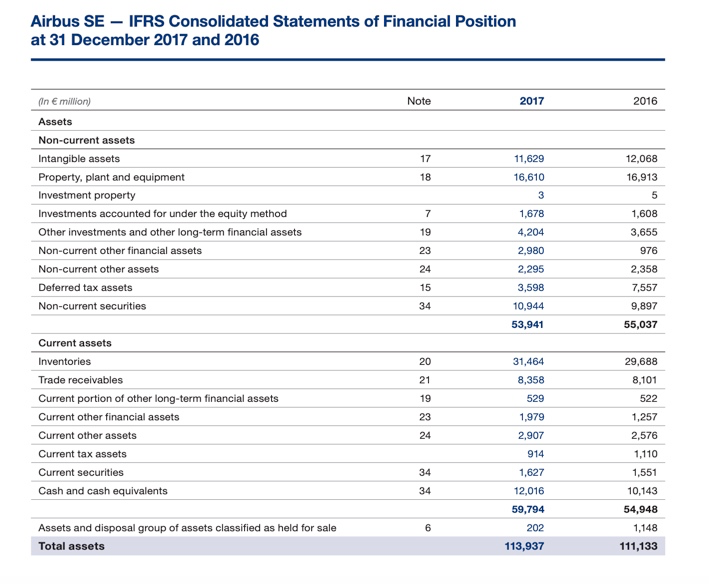
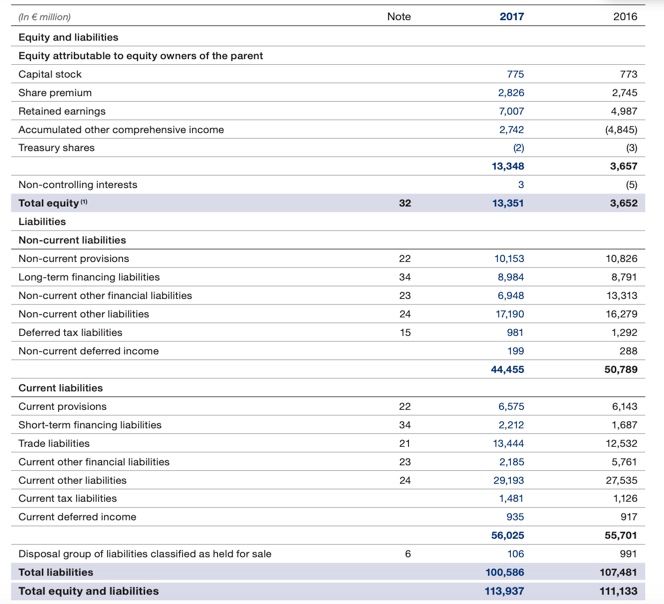
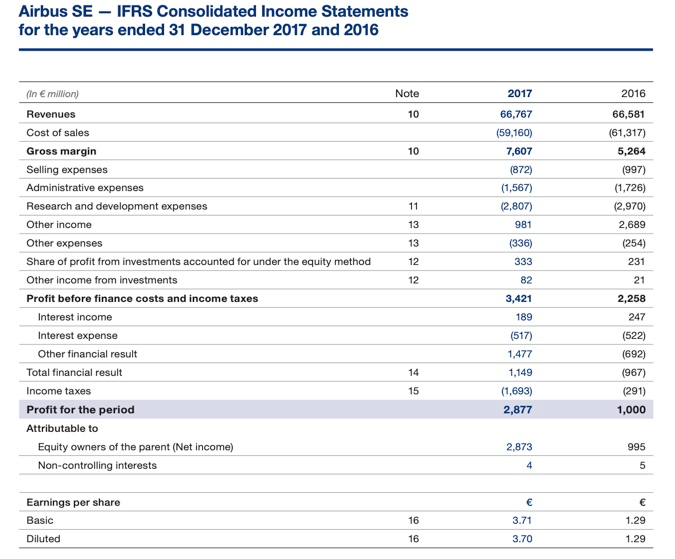
- State the formula for return on assets. What are the returns on assets for Boeing and Airbus in 2017? Based on your returns on assets, which company is more profitable for 2017, Boeing or Airbus? [Put your answer as a percentage, rounded to two decimal places.]
- State the formula for the current ratio. What are the current ratios for Boeing and Airbus in 2017? Based on your current ratios, which company is more liquid in 2017, Boeing or Airbus? [Round your answer to two decimal places.]
- Airbus prepares financial statements using International Financial Reporting Standards (IFRS) and uses revaluation accounting for major classes of its assets. Refer to A look at IFRS, p. 9-54 through 9-55) for a refresher. In FY 2017, Airbus had a revaluation increase of 7,773M in the value of its leased assets. Re-calculate the return on assets on a comparable basis to Boeing. Assume the revaluation was zero in FY 2016. Hint: The revaluation increase is not included in net income.
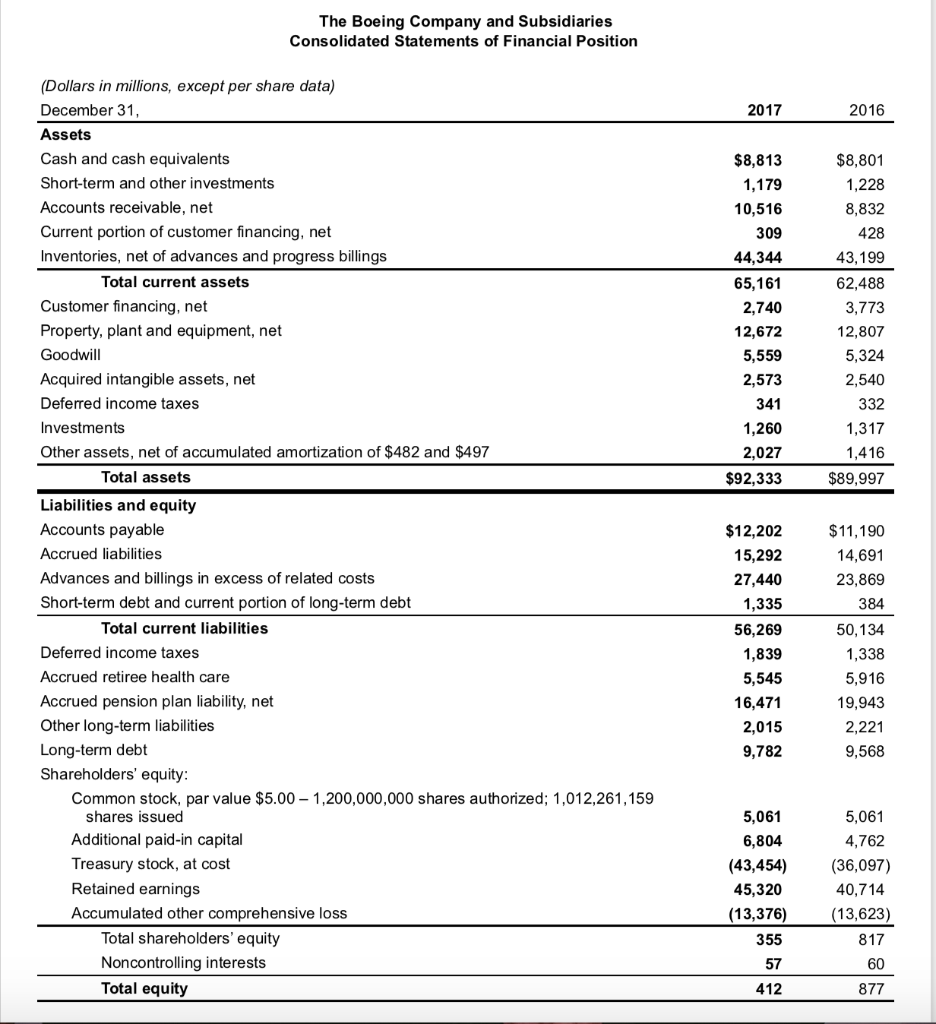
The Boeing Company and Subsidiaries Consolidated Statements of Financial Position 2017 2016 $8,813 1,179 10,516 309 44,344 65,161 2,740 12,672 5,559 2,573 341 1,260 2,027 $92,333 $8,801 1,228 8,832 428 43,199 62,488 3,773 12,807 5,324 2,540 332 1,317 1,416 $89,997 (Dollars in millions, except per share data) December 31, Assets Cash and cash equivalents Short-term and other investments Accounts receivable, net Current portion of customer financing, net Inventories, net of advances and progress billings Total current assets Customer financing, net Property, plant and equipment, net Goodwill Acquired intangible assets, net Deferred income taxes Investments Other assets, net of accumulated amortization of $482 and $497 Total assets Liabilities and equity Accounts payable Accrued liabilities Advances and billings in excess of related costs Short-term debt and current portion of long-term debt Total current liabilities Deferred income taxes Accrued retiree health care Accrued pension plan liability, net Other long-term liabilities Long-term debt Shareholders' equity: Common stock, par value $5.00 - 1,200,000,000 shares authorized; 1,012,261,159 shares issued Additional paid-in capital Treasury stock, at cost Retained earnings Accumulated other comprehensive loss Total shareholders' equity Noncontrolling interests Total equity $12,202 15,292 27,440 1,335 56,269 1,839 5,545 16,471 2,015 9,782 $11,190 14,691 23,869 384 50,134 1,338 5,916 19,943 2,221 9,568 5,061 6,804 (43,454) 45,320 (13,376) 355 5,061 4,762 (36,097) 40,714 (13,623) 817 57 60 412 877 The Boeing Company and Subsidiaries Consolidated Statements of Operations (Dollars in millions, except per share data) Years ended December 31, Sales of products Sales of services Total revenues 2017 $83,204 10,188 93,392 2016 $84,399 10,172 94,571 2015 $85,255 10,859 96,114 Cost of products Cost of services Boeing Capital interest expense Total costs and expenses (68,365) (7,631) (70) (76,066) 17,326 (72,713) (8,018) (59) (80,790) 13,781 303 - (3,616) (4,627) (7) 5,834 (73,446) (8,578) (64) (82,088) 14,026 274 (3,525) (3,331) 204 Income from operating investments, net General and administrative expense Research and development expense, net Gain/loss) on dispositions, net Earnings from operations Other income/(loss), net Interest and debt expense Earnings before income taxes Income tax expense Net earnings (4,094) (3,179) 21 10,278 129 (360) 10,047 (1,850) $8,197 40 (306) 5,568 (673) $4,895 7,443 (13) (275) 7,155 (1,979) $5,176 Basic earnings per share $13.60 Diluted earnings per share $13.43 See Notes to the Consolidated Financial Statements on pages 51 - 105. $7.70 $7.61 $7.52 $7.44 Airbus SE - IFRS Consolidated Statements of Financial Position at 31 December 2017 and 2016 in e million) Note 2017 2016 Assets Non-current assets 11,629 16,610 12,068 16,913 Intangible assets Property, plant and equipment Investment property Investments accounted for under the equity method Other investments and other long-term financial assets 1,678 1,608 Non-current other financial assets Non-current other assets Deferred tax assets 4,204 2,980 2,295 3,598 3,655 976 2,358 7,557 9,897 Non-current securities 10,944 53,941 55,037 Current assets Inventories 31,464 8,358 529 1,979 Trade receivables Current portion of other long-term financial assets Current other financial assets Current other assets Current tax assets Current securities 2,907 914 29,688 8,101 522 1,257 2,576 1.110 1,551 10,143 54,948 1,148 111,133 1,627 Cash and cash equivalents 12,016 59,794 202 113,937 Assets and disposal group of assets classified as held for sale Total assets fin e million) Note 2017 2016 Equity and liabilities Equity attributable to equity owners of the parent 773 Capital stock Share premium Retained earnings 2,745 775 2,826 7,007 2,742 4,987 (4,845) Accumulated other comprehensive income Treasury shares (3) 13,348 3,657 (5) 3,652 13,351 Non-controlling interests Total equity Liabilities Non-current liabilities Non-current provisions Long-term financing liabilities Non-current other financial liabilities 10,153 10,826 8,791 13,313 16,279 1,292 8,984 6,948 17,190 981 199 Non-current other liabilities Deferred tax liabilities Non-current deferred income 288 44,455 50,789 Current liabilities 6,575 2.212 13,444 6,143 1,687 12,532 Current provisions Short-term financing liabilities Trade liabilities Current other financial liabilities Current other liabilities Current tax liabilities Current deferred income 2,185 29,193 1,481 935 5,761 27,535 1,126 917 55,701 991 107,481 111,133 56,025 106 Disposal group of liabilities classified as held for sale Total liabilities Total equity and liabilities 100,586 113,937 Airbus SE - IFRS Consolidated Income Statements for the years ended 31 December 2017 and 2016 (In million) Note 2017 2016 Revenues Cost of sales Gross margin Selling expenses Administrative expenses Research and development expenses Other income Other expenses Share of profit from investments accounted for under the equity method Other income from investments Profit before finance costs and income taxes Interest income Interest expense Other financial result Total financial result Income taxes Profit for the period Attributable to Equity owners of the parent (Net income) Non-controlling interests 66,767 (59,160) 7,607 (872) (1,567) (2,807) 981 (336) 333 82 3,421 189 (517) 1,477 1,149 (1,693) 2,877 66,581 (61,317) 5,264 (997) (1,726) (2.970) 2,689 (254) 231 21 2,258 247 (522) (692) (967) (291) 1,000 14 15 2,873 995 Earnings per share Basic 3.71 1.29 Diluted 16 3.70 1.29