

Question: state the leat square regression line using the r output and t table create 95% CI for the slopewrite complete test for hypothesis with 6
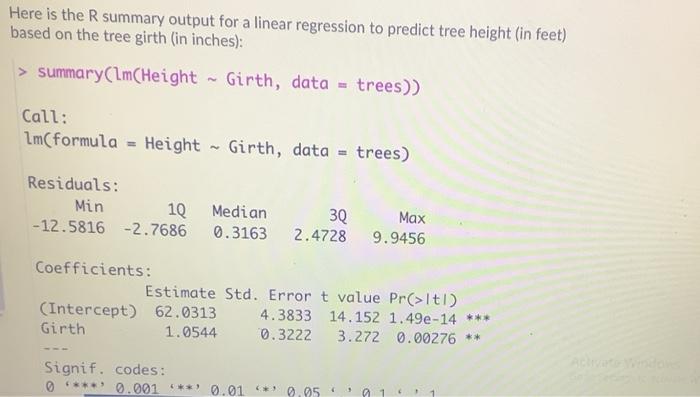
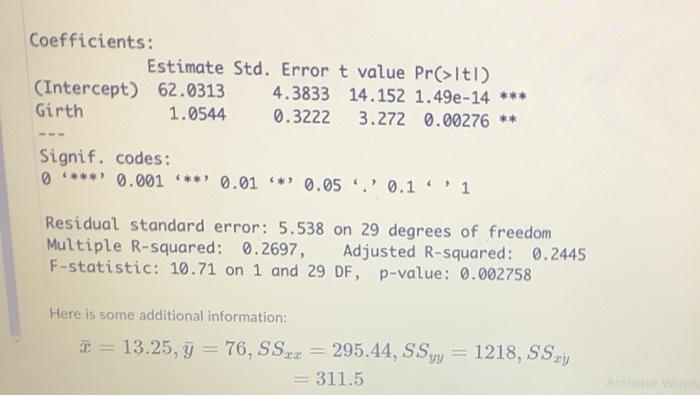
Here is the R summary output for a linear regression to predict tree height (in feet) based on the tree girth (in inches): > summary(Im(Height - Girth, data = trees)) Call: Im(formula = Height - Girth, data = trees) Residuals: Min 10 Median 3Q Max -12.5816 -2.7686 0.3163 2.4728 9.9456 Coefficients: Estimate Std. Error t value Pr(>ltl) (Intercept) 62.0313 4.3833 14.152 1.49e-14 *** Girth 1.0544 0.3222 3.272 0.00276 ** Signif. codes: **** 0.001"**' 0.01 "*0.95 Coefficients: Estimate Std. Error t value Pr(>ltl) (Intercept) 62.9313 4.3833 14.152 1.49e-14 *** Girth 1.0544 0.3222 3.272 0.00276 ** Signif. codes: 0 ****' 0.001 ***' 0.01 **' 0.05.' 0.1'' 1 Residual standard error: 5.538 on 29 degrees of freedom Multiple R-squared: 0.2697, Adjusted R-squared: 0.2445 F-statistic: 10.71 on 1 and 29 DF, p-value: 0.002758 Here is some additional information: T = 13.25, y = 176, SS = 295.44, SSyy = 311.5 1218, SSEY Here is the R summary output for a linear regression to predict tree height (in feet) based on the tree girth (in inches): > summary(Im(Height - Girth, data = trees)) Call: Im(formula = Height - Girth, data = trees) Residuals: Min 10 Median 3Q Max -12.5816 -2.7686 0.3163 2.4728 9.9456 Coefficients: Estimate Std. Error t value Pr(>ltl) (Intercept) 62.0313 4.3833 14.152 1.49e-14 *** Girth 1.0544 0.3222 3.272 0.00276 ** Signif. codes: **** 0.001"**' 0.01 "*0.95 Coefficients: Estimate Std. Error t value Pr(>ltl) (Intercept) 62.9313 4.3833 14.152 1.49e-14 *** Girth 1.0544 0.3222 3.272 0.00276 ** Signif. codes: 0 ****' 0.001 ***' 0.01 **' 0.05.' 0.1'' 1 Residual standard error: 5.538 on 29 degrees of freedom Multiple R-squared: 0.2697, Adjusted R-squared: 0.2445 F-statistic: 10.71 on 1 and 29 DF, p-value: 0.002758 Here is some additional information: T = 13.25, y = 176, SS = 295.44, SSyy = 311.5 1218, SSEY
Step by Step Solution
There are 3 Steps involved in it

Get step-by-step solutions from verified subject matter experts