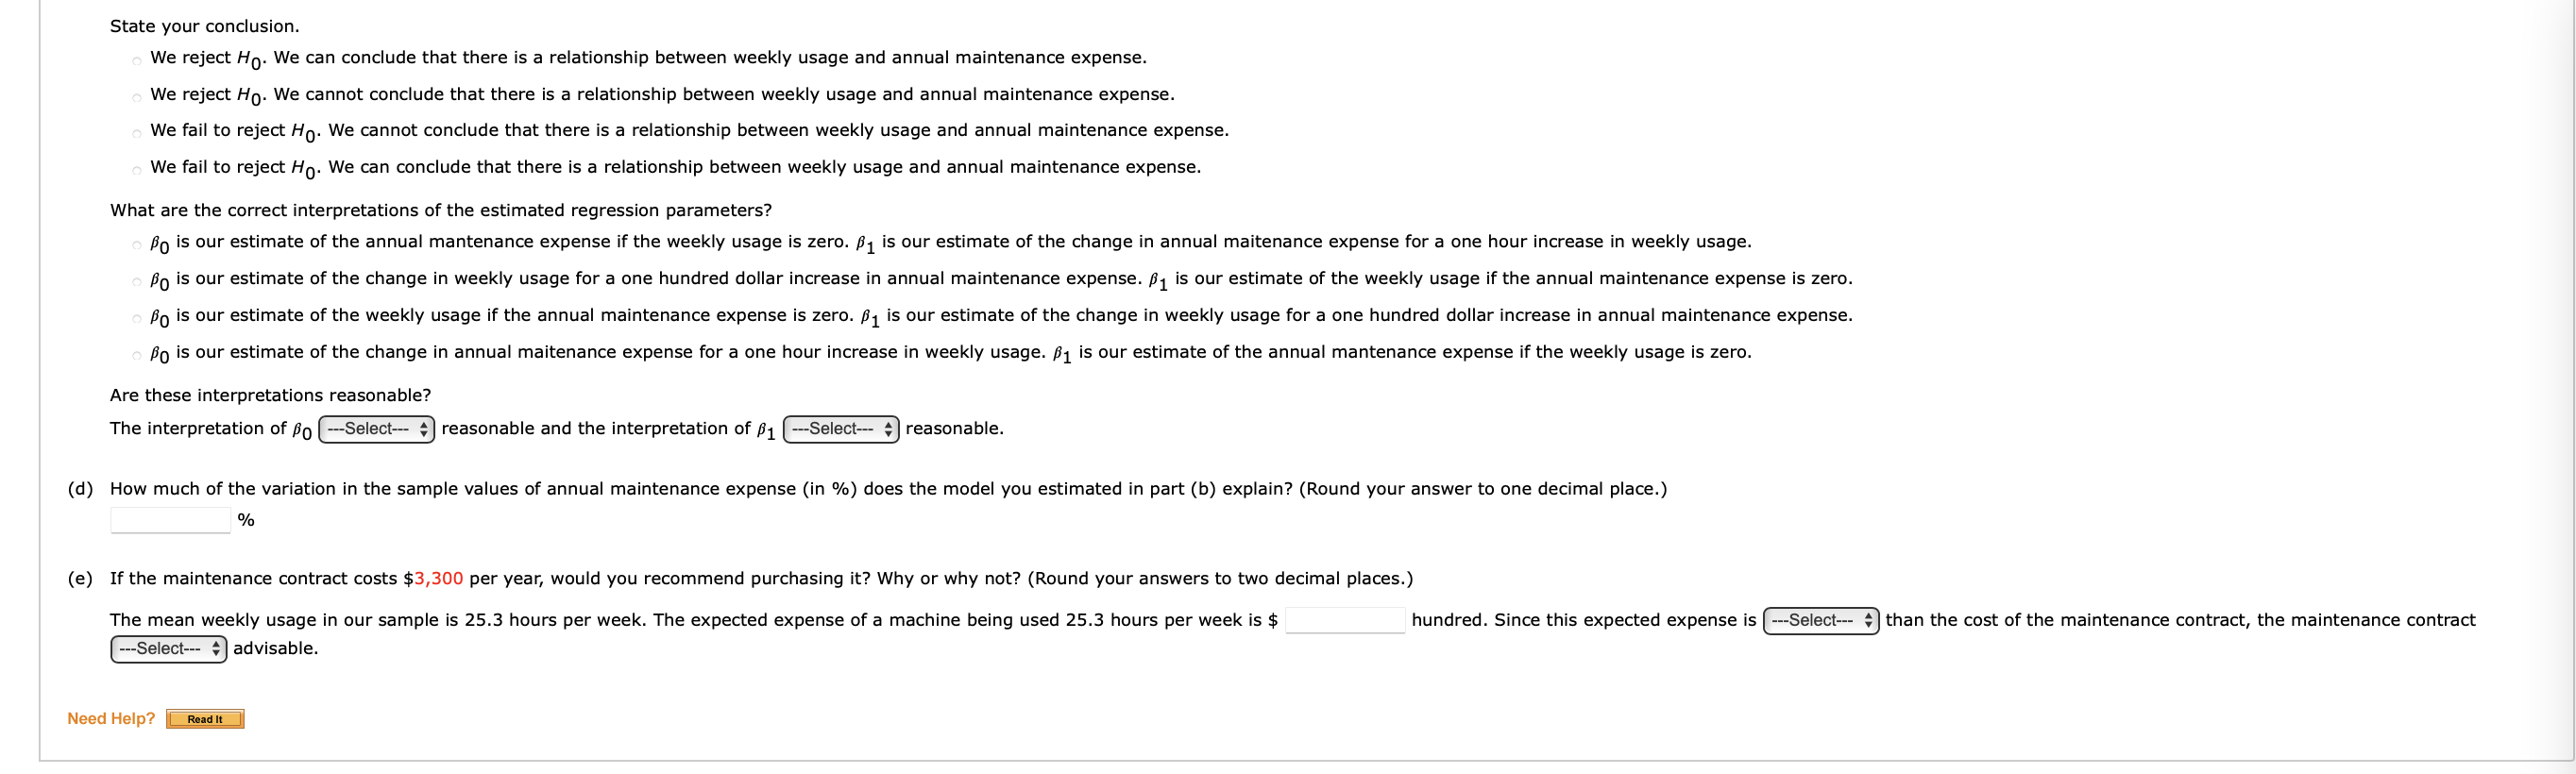
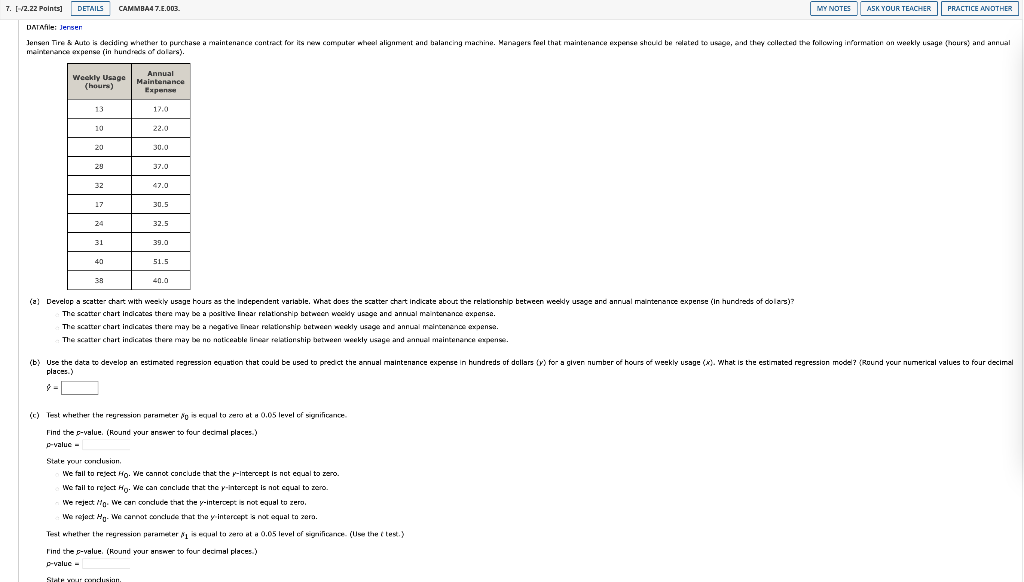
State your conclusion. We reject H0. We can conclude that there is a relationship between weekly usage and annual maintenance expense. We reject H0. We cannot conclude that there is a relationship between weekly usage and annual maintenance expense. We fail to reject H0. We cannot conclude that there is a relationship between weekly usage and annual maintenance expense. We fail to reject H0. We can conclude that there is a relationship between weekly usage and annual maintenance expense. What are the correct interpretations of the estimated regression parameters? 0 is our estimate of the annual mantenance expense if the weekly usage is zero. 1 is our estimate of the change in annual maitenance expense for a one hour increase in wage 0 is our estimate of the change in annual maitenance expense for a one hour increase in weekly usage 1 is our estimate of the annual meen is the Are these interpretations reasonable? The interpretation of 0 reasonable and the interpretation of 1 reasonable. (d) How much of the variation in the sample values of annual maintenance expense (in \%) does the model you estimated in part (b) explain? (Round your answer to one decimal place.) (e) If the maintenance contract costs \$3,300 per year, would you recommend purchasing it? Why or why not? (Round your answers to two decimal places.) The mean weekly usage in our sample is 25.3 hours per week. The expected expense of a machine being used 25.3 hours per week is hundred. Since this expected expense is than the cost of the maintenance contract, the maintenance contract | advisable. Need Help? The scatter chart incicates there may be a pasitive Lnear relat onsip hetween woedy ussge and annual maintenance expense. The scatter chart incicates there may be a nogat we linear relaticoship between weckly usage and annual mainananoe axaense. The scatter chart inticates there may be no naticoable lirear relationship batwoen woekly usage and annual maincenarke expanse. places.) b= (c) Test withether the regression parameter p0 is equal ta zero at a 0,05 level of significarice. Find the g-value. (Round your arswer to four decimal places.) p-value - State pour condusion. We fall to reject H0. We cannet conclude that the -interept is net ecusl to zero. We fall to resoct H0. We can conclude that the y-intereapt is not cqual to zero. We reject H. We can condude that the y-intersept is not equal to zero. We reject 0. We carnot conduce that the yy intercept is not equal ta zera. Find the g-value. (Round your arswer to four deomal places.) p-value