

Answered step by step
Verified Expert Solution
Question
1 Approved Answer
Statements 2013 2014 2015 Sales Revenues Cash Operating Costs Depreciation Total Operating Costs Operating Income (EBIT) 28,255,000 22,321,450 2,775,000 25,096,450 3,158,550 37,340,000 32,112,400 2,915,000 35,027,400
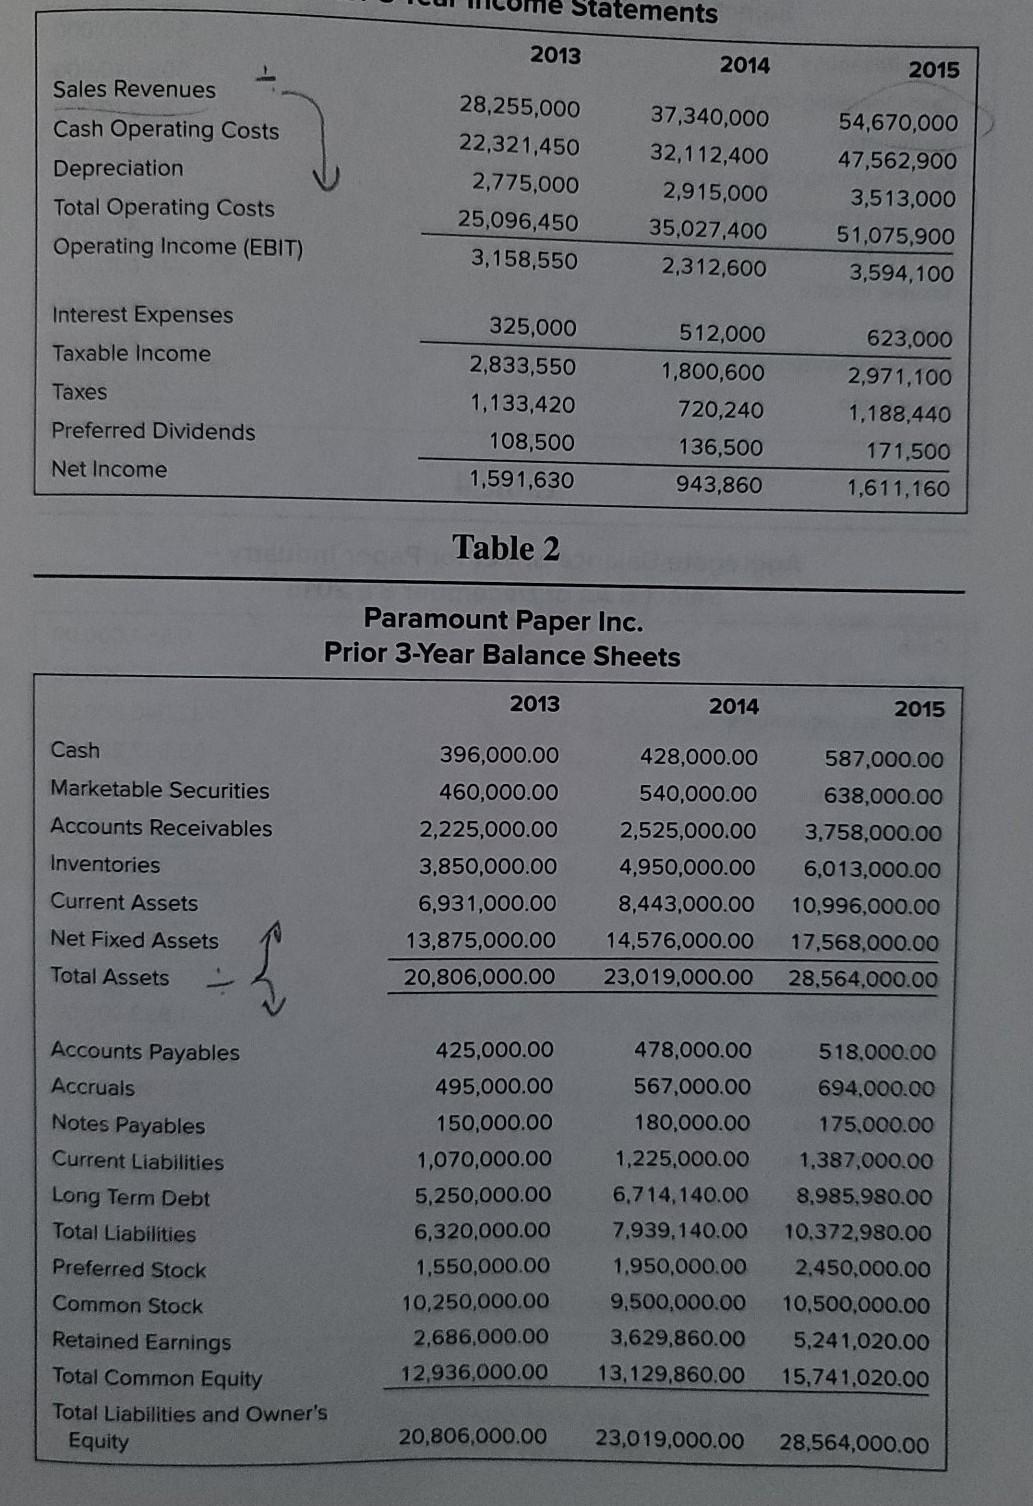
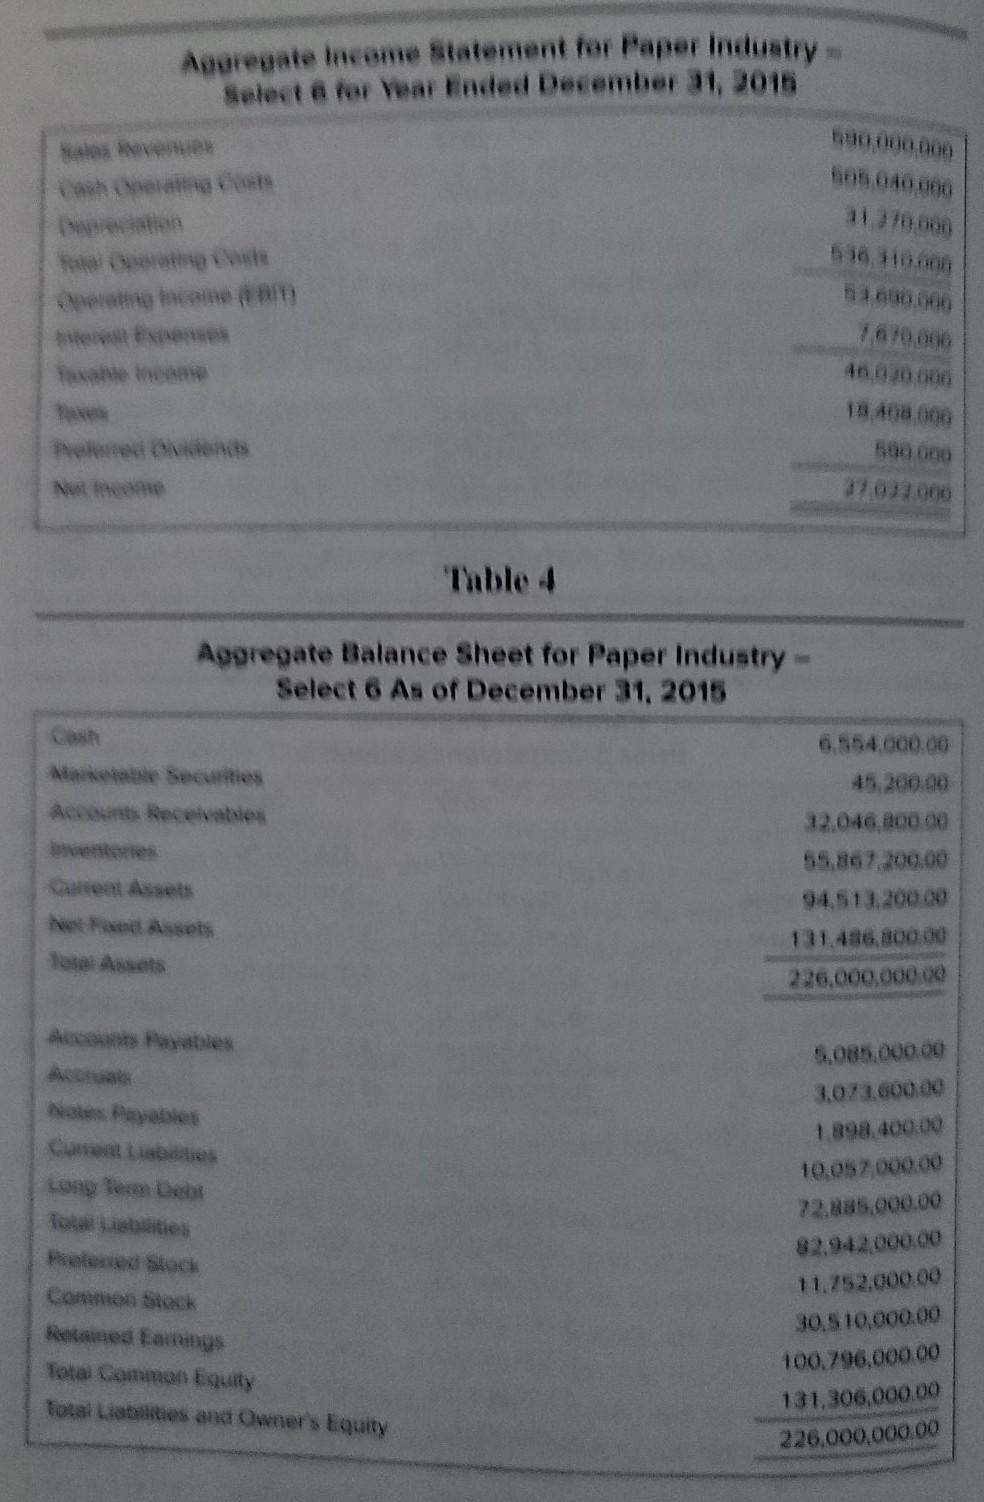
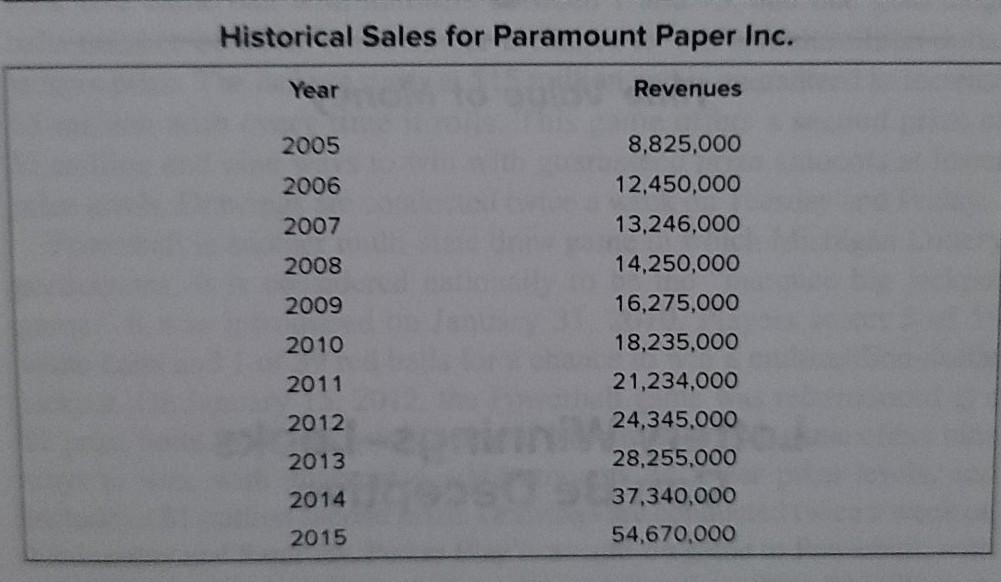
Statements 2013 2014 2015 Sales Revenues Cash Operating Costs Depreciation Total Operating Costs Operating Income (EBIT) 28,255,000 22,321,450 2,775,000 25,096,450 3,158,550 37,340,000 32,112,400 2,915,000 35,027,400 2,312,600 54,670,000 47,562,900 3,513,000 51,075,900 3,594,100 Interest Expenses Taxable income 512,000 1,800,600 623,000 2,971,100 Taxes Preferred Dividends 325,000 2,833,550 1,133,420 108,500 1,591,630 1,188,440 720,240 136,500 943,860 Net Income 171,500 1,611,160 Table 2 Paramount Paper Inc. Prior 3-Year Balance Sheets 2013 2014 2015 Cash 428,000.00 Marketable Securities 540,000.00 Accounts Receivables Inventories 396,000.00 460,000.00 2,225,000.00 3,850,000.00 6,931,000.00 13,875,000.00 20,806,000.00 587,000.00 638,000.00 3,758,000.00 6,013,000.00 10,996,000.00 17,568,000.00 28,564,000.00 2,525,000.00 4,950,000.00 8,443,000.00 14,576,000.00 23,019,000.00 Current Assets Net Fixed Assets Total Assets Accounts Payables Accruals Notes Payables Current Liabilities Long Term Debt Total Liabilities Preferred Stock 425,000.00 495,000.00 150,000.00 1,070,000.00 5,250,000.00 6,320,000.00 1,550,000.00 10,250,000.00 2,686,000.00 12,936,000.00 478,000.00 567,000.00 180,000.00 1,225,000.00 6.714,140.00 7,939,140.00 1,950,000.00 9,500,000.00 3,629,860.00 13,129,860.00 518,000.00 694,000.00 175,000.00 1,387,000.00 8,985,980.00 10.372.980.00 2,450,000.00 10,500,000.00 5,241,020.00 15,741,020.00 Common Stock Retained Earnings Total Common Equity Total Liabilities and Owner's Equity 20,806,000.00 23,019,000.00 28,564,000.00 Accreate Income Statement for Paper Industry Select a for Year Ended December 31, 2015 Cathost 180.000.000 506.040.000 270.000 7670006 46.020,000 18.403,000 27.037.000 Aggregate Balance Sheet for Paper Industry Select 6 As of December 31, 2015 Are Securities 45.200.00 12.046, 00 00 131.486,800.00 226.000,000.00 Notes Payables Long lem Debt 5.085.000.00 3.073.600.00 1.898.400.00 10,057,000.00 22.885.000.00 82.942,000.00 11.252,000.00 30.510,000.00 100.796,000.00 131,306,000.00 226,000,000.00 Commen stock Retained Earrings Total Common Equity Total Liabilities and Owner's Equity Historical Sales for Paramount Paper Inc. Year Revenues 2005 2006 2007 2008 8,825,000 12,450,000 13,246,000 14,250,000 16,275,000 18,235,000 21,234,000 2009 2010 2011 2012 2013 24,345.000 28,255,000 37,340,000 2014 2015 54,670,000 What would Greg discover after performing a DuPont Analy sis on the company's key profitability ratios
Step by Step Solution
There are 3 Steps involved in it
Step: 1

Get Instant Access to Expert-Tailored Solutions
See step-by-step solutions with expert insights and AI powered tools for academic success
Step: 2

Step: 3
Ace Your Homework with AI
Get the answers you need in no time with our AI-driven, step-by-step assistance
Get Started
The Millionaire Next Door The Surprising Secrets Of Americas Wealthy
Authors: Thomas J. Stanley, William D. Danko
1st Edition
1589795474, 978-1589795471