statistic
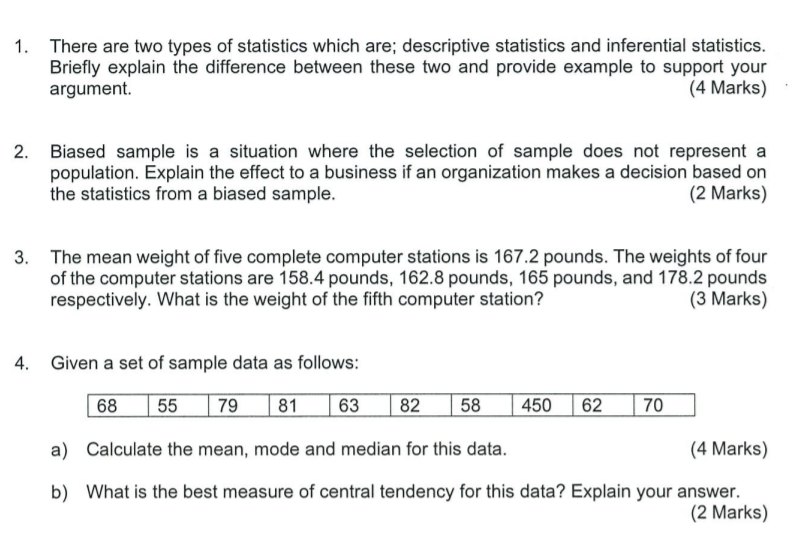
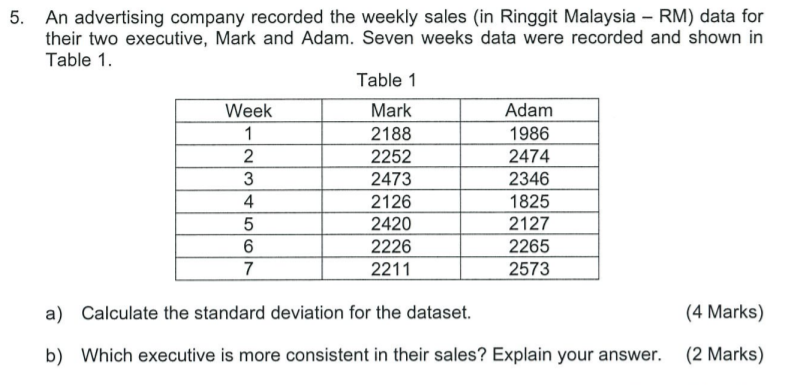
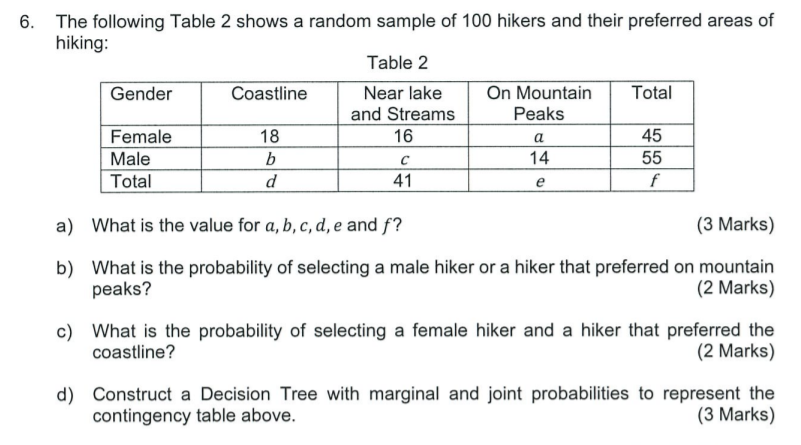
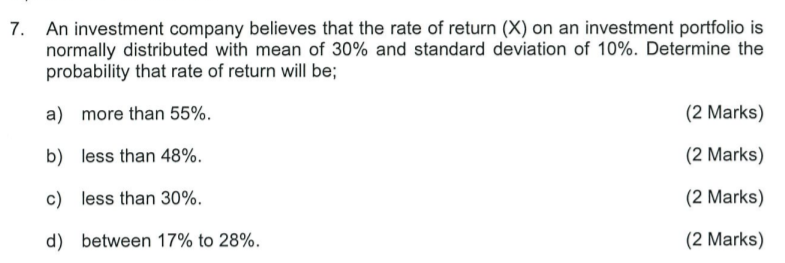
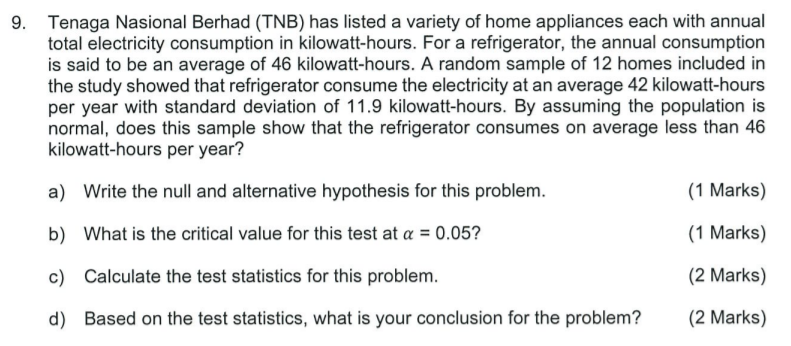
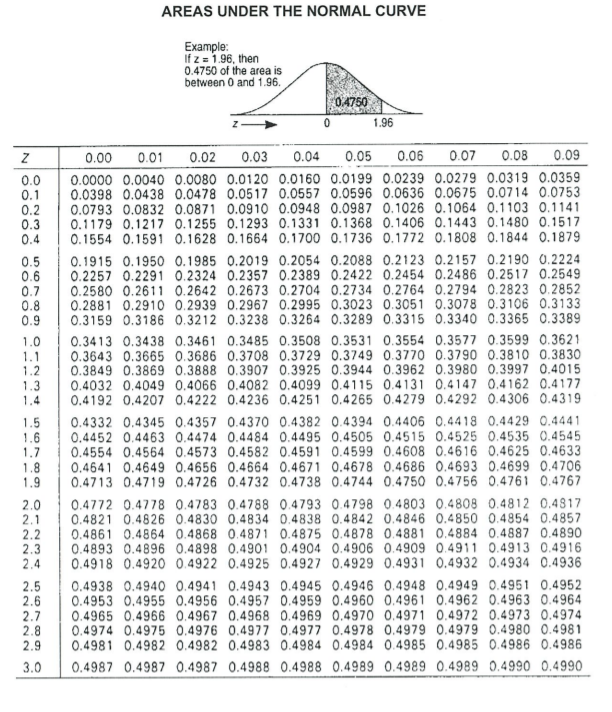
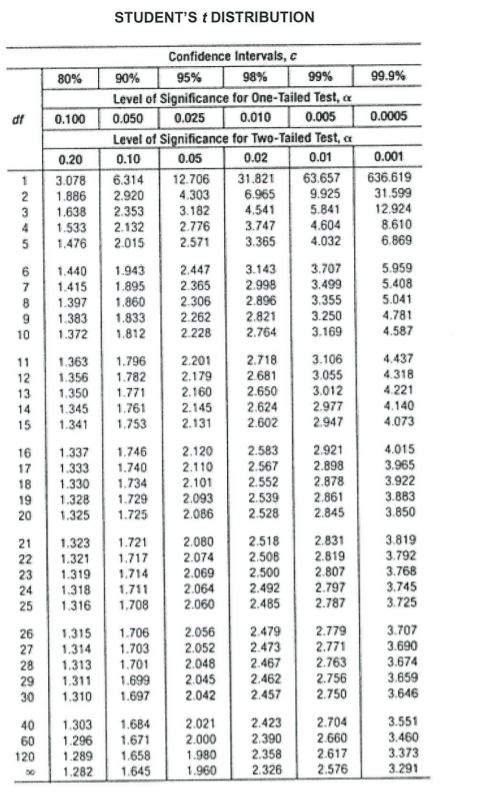
1. There are two types of statistics which are; descriptive statistics and inferential statistics. Briefly explain the difference between these two and provide example to support your argument. (4 Marks) 2. Biased sample is a situation where the selection of sample does not represent a population. Explain the effect to a business if an organization makes a decision based on the statistics from a biased sample. (2 Marks) 3. The mean weight of five complete computer stations is 167.2 pounds. The weights of four of the computer stations are 158.4 pounds, 162.8 pounds, 165 pounds, and 178.2 pounds respectively. What is the weight of the fifth computer station? (3 Marks) 4. Given a set of sample data as follows: 68 55 79 81 63 82 58 450 62 70 a) Calculate the mean, mode and median for this data. (4 Marks) b) What is the best measure of central tendency for this data? Explain your answer. (2 Marks)5. An advertising company recorded the weekly sales (in Ringgit Malaysia - RM) data for their two executive, Mark and Adam. Seven weeks data were recorded and shown in Table 1. 3) Calculate the standard deviation for the dataset. {4 Marks) In) Which executive Is more consistent in their sales? Explain your answer. (2 Marks) The following Table 2 shows a random sample of 100 hikers and their preferred areas of hiking: Table 2 and Streams Peaks -_l'._ _-_ a) What is the value for a. b,c,d,e and f? {3 Marks} b) What is the probability of selecting a male hiker or a hiker that preferred on mountain peaks? (2 Marks) c) What is the probability of selecting a female hiker and a hiker that preferred the coastline? (2 Marks) d) Construct a Decision Tree with marginal and joint probabilities to represent the contingency table above. (3 Marks] An investment company believes that the rate of return (X) on an investment portfolio is normally distributed with mean of 30% and standard deviation of 10%. Determine the probability that rate of return will be: a) more than 55%. [2 Marks) b) less than 43%. {2 Marks) :2) less than 30%. (2 Marks) d) between 17% to 28%. (2 Marks) 8. A t-shirt shop sells clothing at an online platform. They want to determine the relationship between the price of their clothing and the number of t-shirt sold. In 6 weeks period, they change the pricing and collect the number of unit sold. The results are shown in Table 3. Table 3 Week 1 2 3 4 5 6 Price (RM) 10 15 20 25 30 25 Number of units sold 68 60 55 48 38 32 Calculate the correlation of coefficient, r. Interpret the result. (5 Marks)9. Tenaga Nasional Elerhad {TNB) has listed a variety of home appliances each with annual total electricity consumption in kilowatt-hours. For a refrigerator. the annual consumption is said to be an average of 45 kilowatt-hours. A random sample of 12 homes included in the study showed that refrigerator consume the electricity at an average 42 kilowatt-hours per year with standard deviation of 11.9 kilowatt-hours. By assuming the population is normal. does this sample show that the refrigerator consumes on average loss than 46 kilowatt-hours per year? a} Write the null and alternative hypothesis for this problem. (1 Marks] b} What is the critical value for this test at a = 0.05? (1 Marks) 0) Calculate the test statistics for this problem. (2 Marks) cl) Based on the test statistics. what is your conclusion for the problem? (2 Marks) AREAS UNDER THE NORMAL CURVE Example: If z = 1.96, then 0.4750 of the area is between 0 and 1.96. 0 4750 1.96 Z 0.00 0.01 0.02 0.03 0.04 0.05 0.06 0.07 0.08 0.09 0.0 0.0000 0.0040 0.0080 0.0120 0.0160 0.0199 0.0239 0.0279 0.0319 0.0359 0.1 0.0398 0.0438 0.0478 0.0517 0.0557 0.0596 0.0636 0.0675 0.0714 0.0753 0.2 0.0793 0.0832 0.0871 0.0910 0.0948 0.0987 0.1026 0.1064 0.1103 0.1141 0.3 0.1179 0.1217 0.1255 0.1293 0.1331 0.1368 0.1406 0.1443 0.1480 0.1517 0.4 0. 1554 0.1591 0.1628 0.1664 0.1700 0.1736 0.1772 0.1808 0. 1844 0.1879 0.5 0.1915 0.1950 0.1985 0.2019 0.2054 0.2088 0.2123 0.2157 0.2190 0.2224 0.6 0.2257 0.2291 0.2324 0.2357 0.2389 0.2422 0.2454 0.2486 0.2517 0.2549 0.7 0.2580 0.2611 0.2642 0.2673 0.2704 0.2734 0.2764 0.2794 0.2823 0.2852 0.8 0.2881 0.2910 0.2939 0.2967 0.2995 0.3023 0.3051 0.3078 0.3106 0.3133 0.9 0.3159 0.3186 0.3212 0.3238 0.3264 0.3289 0.3315 0.3340 0.3365 0.3389 1.0 0.3413 0.3438 0.3461 0.3485 0.3508 0.3531 0.3554 0.3577 0.3599 0.3621 1.1 0.3643 0.3665 0.3686 0.3708 0.3729 0.3749 0.3770 0.3790 0.3810 0.3830 1.2 0.3849 0.3869 0.3888 0.3907 0.3925 0.3944 0.3962 0.3980 0.3997 0.4015 1.3 0.4032 0.4049 0.4066 0.4082 0.4099 0.4115 0.4131 0.4147 0.4162 0.4177 1.4 0.4192 0.4207 0.4222 0.4236 0.4251 0.4265 0.4279 0.4292 0.4306 0.4319 1.5 0.4332 0.4345 0.4357 0.4370 0.4382 0.4394 0.4406 0.4418 0.4429 0.4441 1.6 0.4452 0.4463 0.4474 0.4484 0.4495 0.4505 0.4515 0.4525 0.4535 0.4545 1.7 0.4554 0.4564 0.4573 0.4582 0.4591 0.4599 0.4608 0.4616 0.4625 0.4633 1.8 0.4641 0.4649 0.4656 0.4564 0.4671 0.4678 0.4686 0.4693 0.4699 0.4706 1.9 0.4713 0.4719 0.4726 0.4732 0.4738 0.4744 0.4750 0.4756 0.4761 0.4767 2.0 0.4772 0.4778 0.4783 0.4788 0.4793 0.4798 0.4803 0.4808 0.4812 0.4817 2.1 0.4821 0.4826 0.4830 0.4834 0.4838 0.4842 0.4846 0.4850 0.4854 0.4857 2.2 0.4861 0.4864 0.4868 0.4871 0.4875 0.4878 0.4881 0.4884 0.4887 0.4890 2.3 0.4893 0.4896 0.4898 0.4901 0.4904 0.4906 0.4909 0.4911 0.4913 0.4916 2.4 0.4918 0.4920 0.4922 0.4925 0.4927 0.4929 0.4931 0.4932 0.4934 0.4936 2.5 0.4938 0.4940 0.4941 0.4943 0.4945 0.4946 0.4948 0.4949 0.4951 0.4952 2.6 0.4953 0.4955 0.4956 0.4957 0.4959 0.4960 0.4961 0.4962 0.4963 0.4964 2.7 0.4965 0.4966 0.4967 0.4968 0.4969 0.4970 0.4971 0.4972 0.4973 0.4974 2.8 0.4974 0.4975 0.4976 0.4977 0.4977 0.4978 0.4979 0.4979 0.4980 0.4981 2.9 0.4981 0.4982 0.4982 0.4983 0.4984 0.4984 0.4985 0.4985 0.4986 0.4986 3.0 0.4987 0.4987 0.4987 0.4988 0.4988 0.4989 0.4989 0.4989 0.4990 0.4990\f
