Answered step by step
Verified Expert Solution
Link Copied!

Question

1 Approved Answer

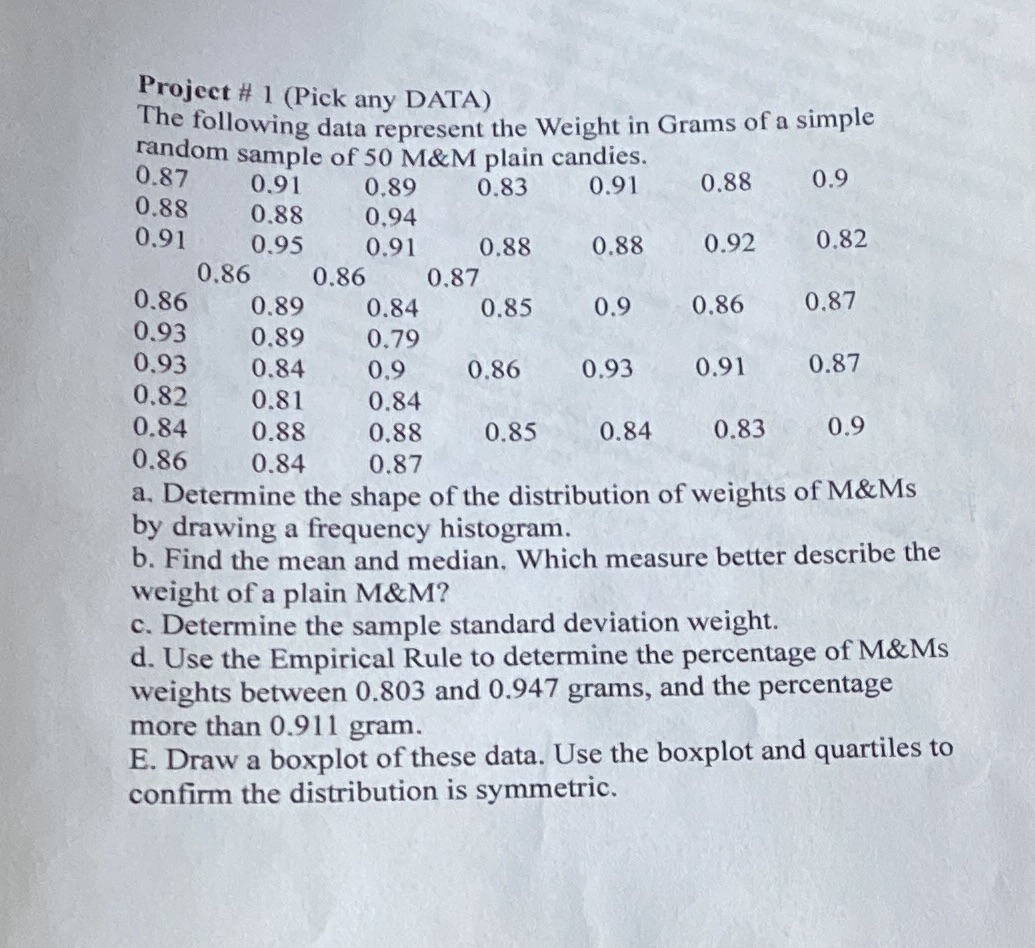
Statistic and probability Project # 1 (Pick any DATA) The following data represent the Weight in Grams of a simple random sample of 50 M&M

Statistic and probability

image text in transcribed
Project # 1 (Pick any DATA) The following data represent the Weight in Grams of a simple random sample of 50 M&M plain candies. 0.87 0.91 0.89 0.83 0.91 0.88 0.9 0.88 0.88 0.94 0.91 0.95 0.91 0.88 0.88 0.92 0.82 0.86 0.86 0.87 0.86 0.89 0.84 0.85 0.9 0.86 0.87 0.93 0.89 0.79 0.93 0.84 0.9 0.86 0.93 0.91 0.87 0.82 0.81 0.84 0.84 0.88 0.88 0.85 0.84 0.83 0.9 0.86 0.84 0.87 a. Determine the shape of the distribution of weights of M&Ms by drawing a frequency histogram. b. Find the mean and median. Which measure better describe the weight of a plain M&M? c. Determine the sample standard deviation weight. d. Use the Empirical Rule to determine the percentage of M&Ms weights between 0.803 and 0.947 grams, and the percentage more than 0.911 gram. E. Draw a boxplot of these data. Use the boxplot and quartiles to confirm the distribution is symmetric

Step by Step Solution

There are 3 Steps involved in it

Step: 1

blur-text-image

Get Instant Access to Expert-Tailored Solutions

See step-by-step solutions with expert insights and AI powered tools for academic success

Step: 2

blur-text-image

Step: 3

blur-text-image

Ace Your Homework with AI

Get the answers you need in no time with our AI-driven, step-by-step assistance

Get Started

Recommended Textbook for

More Books

Students also viewed these Mathematics questions

Question

decode the openweathermap api swiftUI

Answered: 1 week ago