

Answered step by step
Verified Expert Solution
Question
1 Approved Answer
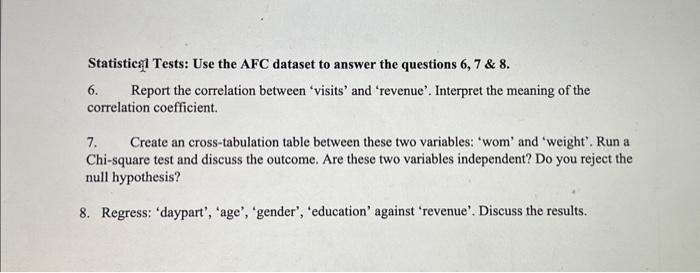
Statistic g 1 Tests: Use the AFC dataset to answer the questions 6,7&8. 6. Report the correlation between 'visits' and 'revenue'. Interpret the meaning of
Step by Step Solution
There are 3 Steps involved in it
Step: 1

Get Instant Access to Expert-Tailored Solutions
See step-by-step solutions with expert insights and AI powered tools for academic success
Step: 2

Step: 3
Ace Your Homework with AI
Get the answers you need in no time with our AI-driven, step-by-step assistance
Get Started
SAP S/4 HANA For Financial Accounting Associates SAP Certified Application Associate
Authors: D Jacobs ,S Matiana
1st Edition
1545316171, 978-1545316177