

Answered step by step
Verified Expert Solution
Question
1 Approved Answer
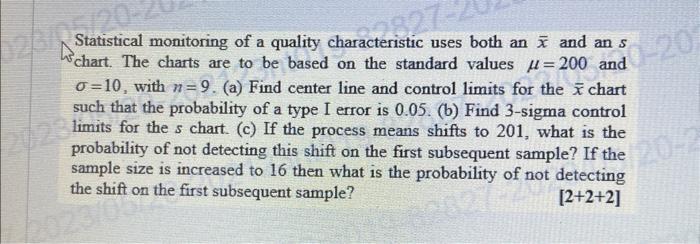
Statistical monitoring of a quality characteristic uses both an x and an s chart. The charts are to be based on the standard values =200
Step by Step Solution
There are 3 Steps involved in it
Step: 1

Get Instant Access to Expert-Tailored Solutions
See step-by-step solutions with expert insights and AI powered tools for academic success
Step: 2

Step: 3
Ace Your Homework with AI
Get the answers you need in no time with our AI-driven, step-by-step assistance
Get Started
Essential Practices For Managing Chemical Reactivity Hazards
Authors: Robert W. Johnson, Steven W. Rudy, Stephen D. Unwin
1st Edition
0816908966, 978-0816908967