Answered step by step
Verified Expert Solution
Link Copied!

Question

1 Approved Answer

Statistics [10] 10. For the following 11 = 8 data values (0,2), (0,3), (1, 3), (4,4), (9,5), (1, 2), (O, 1), (4, 5) the model

Statistics
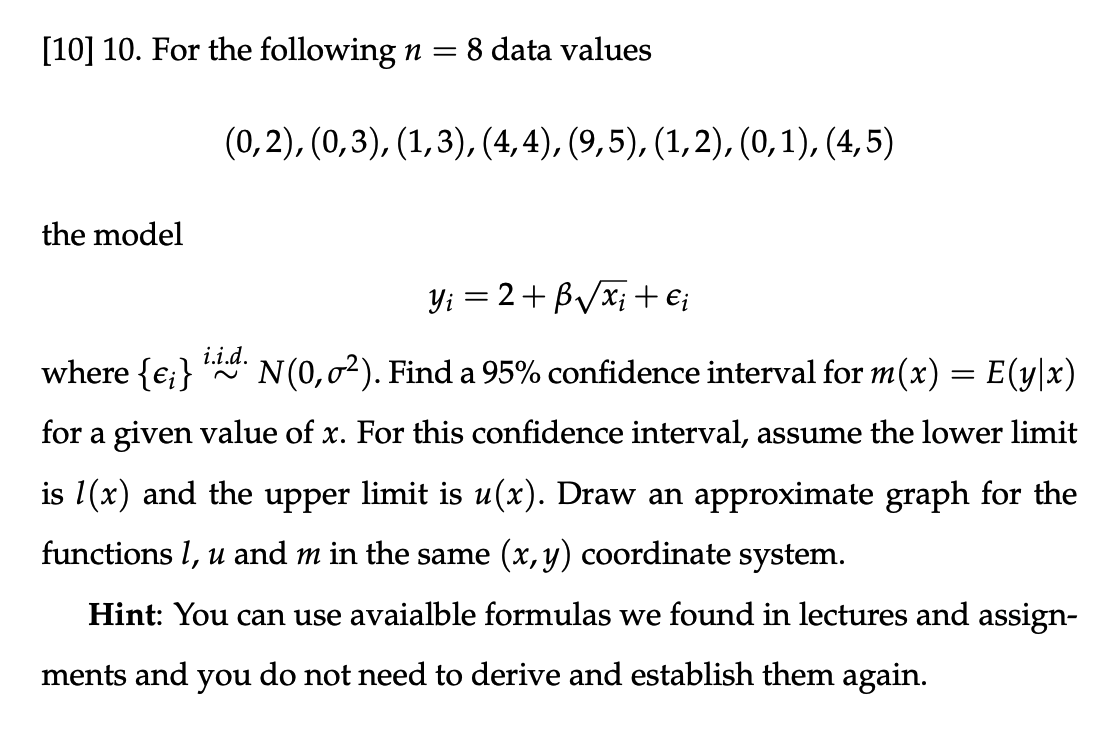
image text in transcribed
[10] 10. For the following 11 = 8 data values (0,2), (0,3), (1, 3), (4,4), (9,5), (1, 2), (O, 1), (4, 5) the model yi = 2 + [Bx/x7 + e;- N (0, 0'2). Find a 95% condence interval for m (x) = E (yl x) for a given value of x. For this condence interval, assume the lower limit where {6,} i'' is 1(x) and the upper limit is u(x). Draw an approximate graph for the functions I, u and m in the same (3:, y) coordinate system. Hint: You can use avaialble formulas we found in lectures and assign- ments and you do not need to derive and establish them again

Step by Step Solution

There are 3 Steps involved in it

Step: 1

blur-text-image

Get Instant Access to Expert-Tailored Solutions

See step-by-step solutions with expert insights and AI powered tools for academic success

Step: 2

blur-text-image

Step: 3

blur-text-image

Ace Your Homework with AI

Get the answers you need in no time with our AI-driven, step-by-step assistance

Get Started

Recommended Textbook for

Business Analytics Data Analysis and Decision Making

Authors: S. Christian Albright, Wayne L. Winston

5th edition

1133629601, 9781285965529 , 978-1133629603

More Books

Students also viewed these Mathematics questions