Answered step by step
Verified Expert Solution
Link Copied!

Question

1 Approved Answer

Statistics 2 1- The following dataset gives the midterm scores of all students in statistics class: 21 67 68 19 40 56 23 78 79

Statistics 2
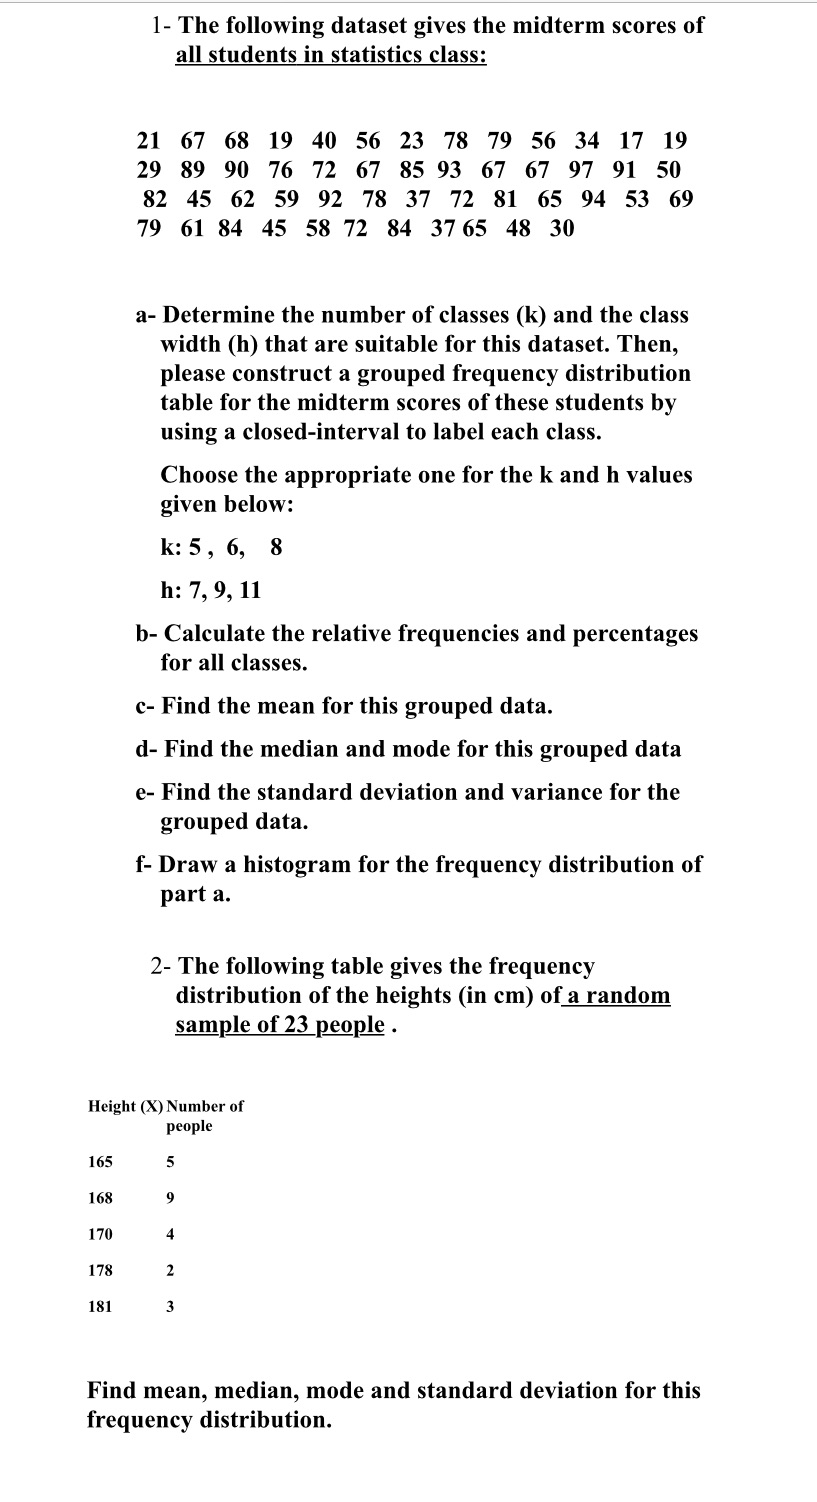
image text in transcribed
1- The following dataset gives the midterm scores of all students in statistics class: 21 67 68 19 40 56 23 78 79 56 34 17 19 29 89 90 76 72 67 85 93 67 67 97 91 SI} 82 45 62 59 92 78 37 72 81 65 94 53 69 79 61 84 45 58 72 84 37 65 48 30 a- Determine the number of classes (k) and the class width (h) that are suitable for this dataset. Then, please construct a grouped frequency distribution table for the midterm scores of these students by using a closed-interval to label each class. Choose the appropriate one for the k and h values given below: k:5, 6, 8 h: 7,9,11 b- Calculate the relative frequencies and percentages for all classes. c- Find the mean for this grouped data. d- Find the median and mode for this grouped data e- Find the standard deviation and variance for the grouped data. f- Draw a histogram for the frequency distribution of part a. 2- The following table gives the frequency distribution of the heights (in cm) of a random mph of 23 ppl_e . Height (X) Number of I65 168 170 178 181 people 5 9 4 2 3 Find mean, median, mode and standard deviation for this frequency distribution

Step by Step Solution

There are 3 Steps involved in it

Step: 1

blur-text-image

Get Instant Access to Expert-Tailored Solutions

See step-by-step solutions with expert insights and AI powered tools for academic success

Step: 2

blur-text-image_2

Step: 3

blur-text-image_3

Ace Your Homework with AI

Get the answers you need in no time with our AI-driven, step-by-step assistance

Get Started

Recommended Textbook for

Modeling the Dynamics of Life Calculus and Probability for Life Scientists

Authors: Frederick R. Adler

3rd edition

840064187, 978-1285225975, 128522597X, 978-0840064189

More Books

Students also viewed these Mathematics questions