Statistics analysis.
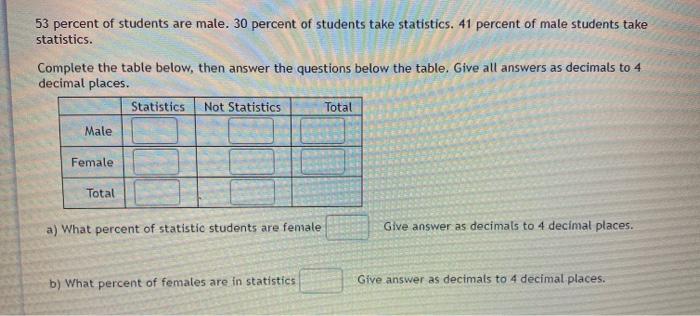
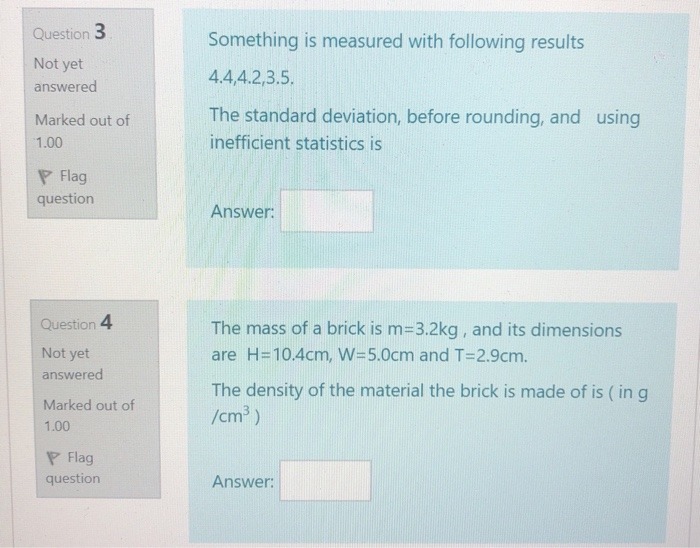
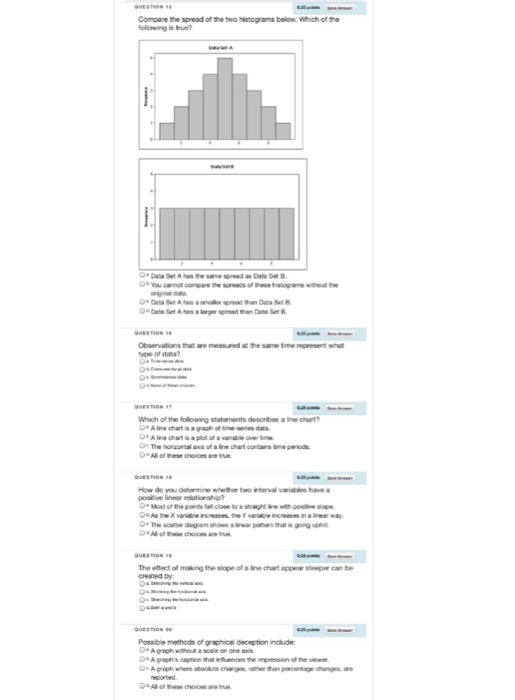
D1: How An understanding of statistics is necessary in any job. The use of statistics can help 24 24 Can you Use provide answers to many questions. Please, post a question you think that statistics Statistics may help you answer and explain why statistics can help provide an accurate answer. Read several of your classmates' postings. Do you agree that statistics are necessary to answer their questions? Is their question one that you would also like to have an answer to? Why or why not? Please make sure to comply with all Netiquette Guidelines listed in the Getting Started module.53 percent of students are male. 30 percent of students take statistics. 41 percent of male students take statistics. Complete the table below, then answer the questions below the table, Give all answers as decimals to 4 decimal places. Statistics Not Statistics Total Male Female Total a) What percent of statistic students are female Give answer as decimals to 4 decimal places. b) What percent of females are in statistics Give answer as decimals to 4 decimal places.Question 3 Something is measured with following results Not yet 4.4,4.2,3.5. answered Marked out of The standard deviation, before rounding, and using 1.00 inefficient statistics is Flag question Answer: Question 4 The mass of a brick is m=3.2kg , and its dimensions Not yet are H=10.4cm, W=5.0cm and T=2.9cm. answered The density of the material the brick is made of is ( in g Marked out of /cm ) 1.00 Flag question Answer:QUESTION TA Compare the spread of the two histograms below Which of the following is true? DAYou cannot compon the tenido of their Observations that are measured at the same time mepies Which of the following statements describes a ine chart? 0* A line chart is a graph of time-were data. Of The horizontal mnis of a line chart contains Simp periods. The eflact of making the dope of a line chart appears Possible methods of graphical deception includes 0* A proph without a scale on one cals