Statistics and probability
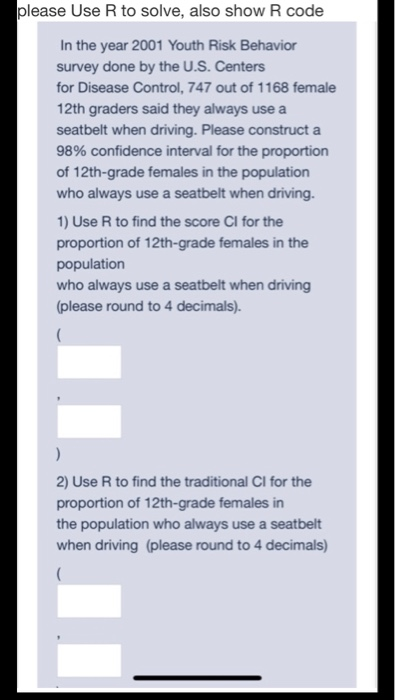
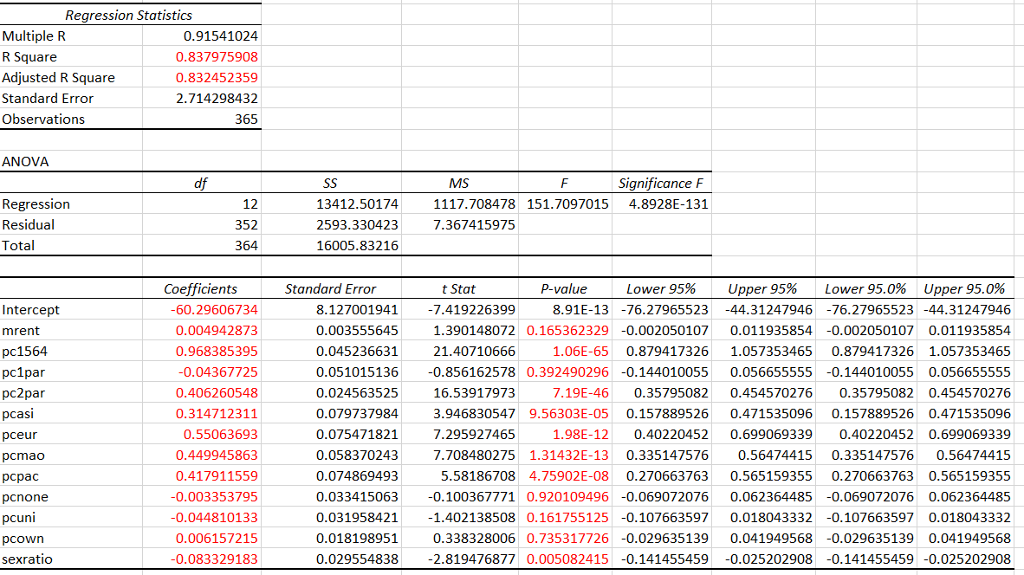
please Use R to solve, also show R code In the year 2001 Youth Risk Behavior survey done by the U.S. Centers for Disease Control, 747 out of 1168 female 12th graders said they always use a seatbelt when driving. Please construct a 98% confidence interval for the proportion of 12th-grade females in the population who always use a seatbelt when driving. 1) Use R to find the score Cl for the proportion of 12th-grade females in the population who always use a seatbelt when driving (please round to 4 decimals). 2) Use R to find the traditional Cl for the proportion of 12th-grade females in the population who always use a seatbelt when driving (please round to 4 decimals)Regression Statistics Multiple R 0.91541024 R Square 0.837975908 Adjusted R Square 0.832452359 Standard Error 2.714298432 Observations 365 ANOVA df SS MS F Significance F Regression 12 13412.50174 1117.708478 151.7097015 4.8928E-131 Residual 352 2593.330423 7.367415975 Total 364 16005.83216 Coefficients Standard Error t Stat P-value Lower 95% Upper 95% Lower 95.0% Upper 95.0% Intercept -60.29606734 8.127001941 -7.419226399 8.91E-13 -76.27965523 -44.31247946 -76.27965523 -44.31247946 mrent 0.004942873 0.003555645 1.390148072 0.165362329 -0.002050107 0.011935854 -0.002050107 0.011935854 pc1564 0.968385395 0.045236631 21.40710666 1.06E-65 0.879417326 1.057353465 0.879417326 1.057353465 pcipar -0.04367725 0.051015136 -0.856162578 0.392490296 -0.144010055 0.056655555 -0.144010055 0.056655555 pc2par 0.406260548 0.024563525 16.53917973 7.19E-46 0.35795082 0.454570276 0.35795082 0.454570276 pcasi 0.314712311 0.079737984 3.946830547 9.56303E-05 0.157889526 0.471535096 0.157889526 0.471535096 pceur 0.55063693 0.075471821 7.295927465 1.98E-12 0.40220452 0.699069339 0.40220452 0.699069339 pcmao 0.449945863 0.058370243 7.708480275 1.31432E-13 0.335147576 0.56474415 0.335147576 0.56474415 pcpac 0.417911559 0.074869493 5.58186708 4.75902E-08 0.270663763 0.565159355 0.270663763 0.565159355 pcnone -0.003353795 0.033415063 -0.100367771 0.920109496 -0.069072076 0.062364485 -0.069072076 0.062364485 pcuni -0.044810133 0.031958421 -1.402138508 0.161755125 -0.107663597 0.018043332 -0.107663597 0.018043332 pcown 0.006157215 0.018198951 0.338328006 0.735317726 -0.029635139 0.041949568 -0.029635139 0.041949568 sexratio -0.083329183 0.029554838 -2.819476877 0.005082415 -0.141455459 -0.025202908 -0.141455459 -0.0252029081. Orthogonally diagonalize the following matrices, if possible. If it is possi- ble, give the spectral decomposition of the matrix. (a) 2 to (b) 2 to 0 1 2 09 - K (c) 0 3 0 2. Use the spectral decomposition (in reverse) to find the matrix A such that (1, -1, 1) is an eigenvector with eigenvalue 2, and (2,3, 1) and (4, -1, 5) are eigenvectors with eigenvalue -3.Spectral decomposition refers to the process of separating a vector according to eigenspaces corresponding to a linear operator. 0 A M Do U i U U 6 Figure 1: Signal decomposition. This process is widely used for analyzing soundJ light? and many other wave signals. For example1 consider modeling signals by the vector space V = span [sin(t) ,cos[t)) , and their propagation over a medium by the linear operator T : V > V given by T(sin{t)) = 2cos{t) sin(t) and T(cos(t)) = 2 sin(t) cos(t) . 13. (5 points} Find the matrix representation of the operator with respect to the basis 3 = {sin(t) ,cos(t)}