Statistics and probability problems:-
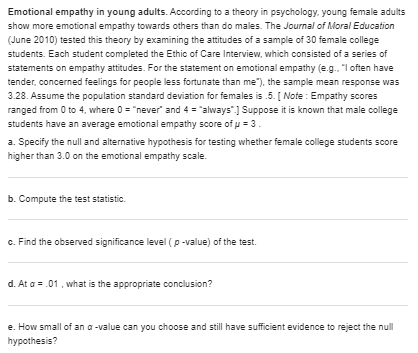
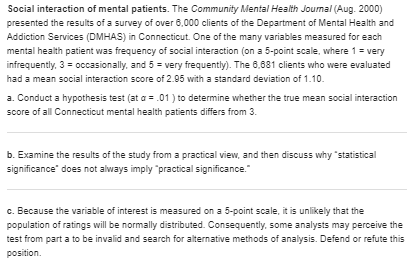
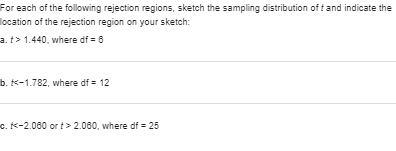
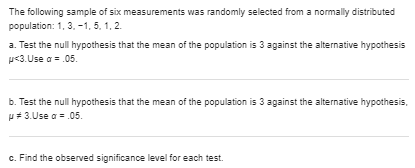
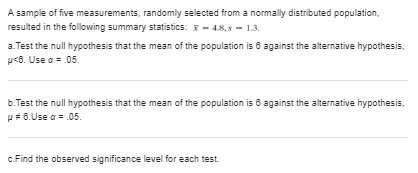
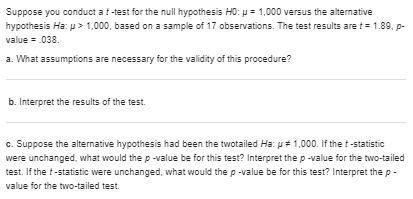
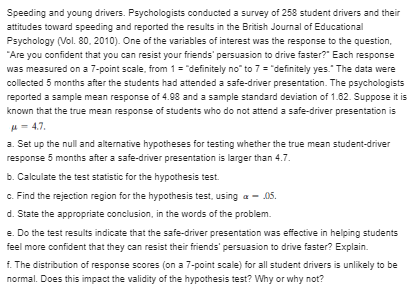
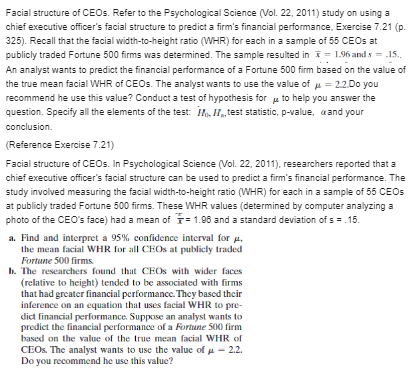
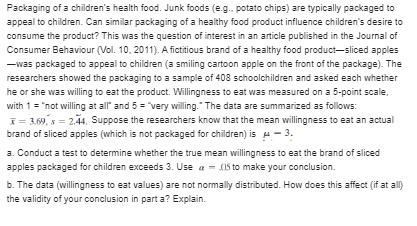
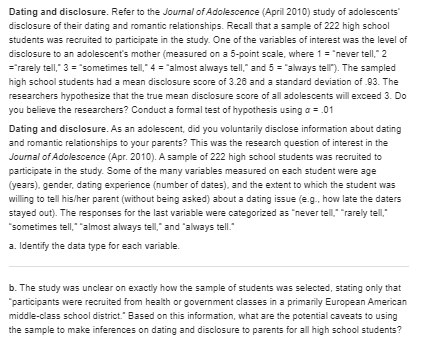
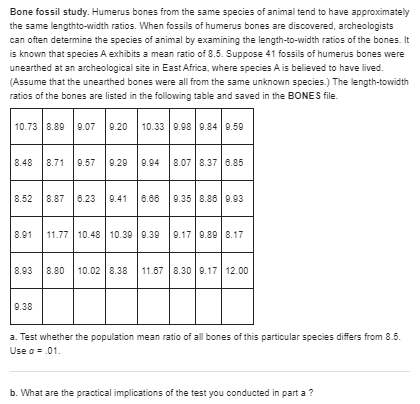
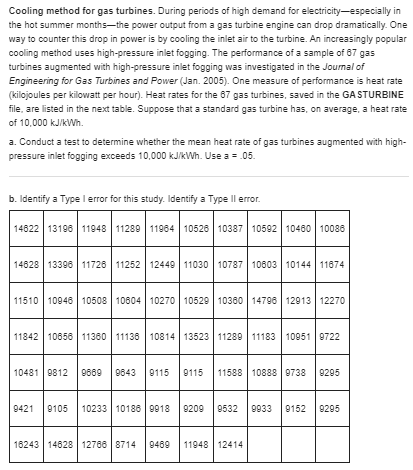
Emotional empathy in young adults. According to a theory in psychology, young female adults show more emotional empathy towards others than do males. The Journal of Moral Education (June 2010) tested this theory by examining the attitudes of a sample of 30 female college students. Each student completed the Ethic of Care Interview, which consisted of a series of statements on empathy attitudes. For the statement on emotional empathy (e.g.. "I often have tender, concerned feelings for people less fortunate than me"), the sample mean response was 3.28. Assume the population standard deviation for females is .5. [ Note : Empathy scores ranged from 0 to 4. where 0 = "never" and 4 = "always"] Suppose it is known that male college students have an average emotional empathy score of p = 3 . a. Specify the null and alternative hypothesis for testing whether female college students score higher than 3.0 on the emotional empathy scale. b. Compute the test statistic. c. Find the observed significance level ( p -value) of the test. d. At a = .01 , what is the appropriate conclusion? e. How small of an o -value can you choose and still have sufficient evidence to reject the null hypothesis?Suppose you are interested in conducting the statistical test of HO: p = 200 against HO: p > 200. and you have decided to use the following decision rule: Reject HO if the sample mean of a random sample of 100 items is more than 215. Assume that the standard deviation of the population is 80. a. Express the decision rule in terms of z. b. Find a, the probability of making a Type I error, by using this decision rule.Social interaction of mental patients. The Community Mental Health Joumal (Aug. 2000) presented the results of a survey of over 8,000 clients of the Department of Mental Health and Addiction Services (DMHAS) in Connecticut. One of the many variables measured for each mental health patient was frequency of social interaction (on a 5-point scale, where 1 = very infrequently, 3 = occasionally, and 5 = very frequently). The 8.681 clients who were evaluated had a mean social interaction score of 2 95 with a standard deviation of 1.10. a. Conduct a hypothesis test (at a = .01 ) to determine whether the true mean social interaction score of all Connecticut mental health patients differs from 3. b. Examine the results of the study from a practical view, and then discuss why "statistical significance" does not always imply "practical significance." c. Because the variable of interest is measured on a 5-point scale, it is unlikely that the population of ratings will be normally distributed. Consequently, some analysts may perceive the test from part a to be invalid and search for alternative methods of analysis. Defend or refute this position.For each of the following rejection regions, sketch the sampling distribution of f and indicate the ocation of the rejection region on your sketch: 3. f> 1.440. where of = 6 b. * 2.060, where of = 25The following sample of six measurements was randomly selected from a normally distributed population: 1, 3. -1, 5, 1, 2. a. Test the null hypothesis that the mean of the population is 3 against the alternative hypothesis J 1,000, based on a sample of 17 observations. The test results are f = 1.89, p- value = 038. a. What assumptions are necessary for the validity of this procedure? b. Interpret the results of the test. c. Suppose the alternative hypothesis had been the twotailed Harp # 1,000. If the f-statistic were unchanged, what would the p -value be for this test? Interpret the p -value for the two-tailed test. If the f-statistic were unchanged, what would the p -value be for this test? Interpret the p - value for the two-tailed test.Dental anxiety study. Refer to the BMC Oral Health (Vol. 9, 2009) study of adults who completed the Dental Anxiety Scale, presented in Exercise. Recall that scores range from 0 (no anxiety) to 25 (extreme anxiety). Summary statistics for the scores of 15 adults who completed the questionnaire are 7 = 10.7 and s = 3.6. Conduct a test of hypothesis to determine whether the mean Dental Anxiety Scale score for the population of college students differs from p = 11. Use a = .05.Speeding and young drivers. Psychologists conducted a survey of 258 student drivers and their attitudes toward speeding and reported the results in the British Journal of Educational Psychology (Vol. 80, 2010). One of the variables of interest was the response to the question, "Are you confident that you can resist your friends'persuasion to drive faster?" Each response was measured on a 7-point scale, from 1 = "definitely no" to 7 = "definitely yes." The data were collected 5 months after the students had attended a safe-driver presentation. The psychologists reported a sample mean response of 4.98 and a sample standard deviation of 1 62. Suppose it is known that the true mean response of students who do not attend a safe-driver presentation is # =47. 3. Set up the null and alternative hypotheses for testing whether the true mean student-driver response 5 months after a safe-driver presentation is larger than 4.7. b. Calculate the test statistic for the hypothesis test c. Find the rejection region for the hypothesis test, using a - 105. d. State the appropriate conclusion, in the words of the problem. e. Do the test results indicate that the safe-driver presentation was effective in helping students feel more confident that they can resist their friends' persuasion to drive faster? Explain. f. The distribution of response scores (on a 7-point scale) for all student drivers is unlikely to be normal. Does this impact the validity of the hypothesis test? Why or why not?Facial structure of CEOs. Refer to the Psychological Science (Vol. 22, 2011) study on using a chief executive officer's facial structure to predict a firm's financial performance, Exercise 7.21 (p. 325). Recall that the facial width-to-height ratio (WHR) for each in a sample of 55 CEOs at publicly traded Fortune 500 firms was determined. The sample resulted in * = 1.96 and: = .15.. An analyst wants to predict the financial performance of a Fortune 500 firm based on the value of the true mean facial WAR of CEOs. The analyst wants to use the value of A = 22 Do you recommend he use this value? Conduct a test of hypothesis for u to help you answer the question. Specify all the elements of the test: 1/). /7,, test statistic, p-value, aand your conclusion. (Reference Exercise 7.21) Facial structure of CEOs. In Psychological Science (Vol. 22, 2011), researchers reported that a chief executive officer's facial structure can be used to predict a firm's financial performance. The study involved measuring the facial width-to-height ratio (WHR) for each in a sample of 55 CEOs at publicly traded Fortune 500 firms. These WHR values (determined by computer analyzing a photo of the CEO's face) had a mean of Y= 1.06 and a standard deviation of s = .15. a. Find and interpret a 95% confidence interval for p. the mean facial WHR for all CEOs at publicly traded Fortune 500 firms h. The researchers found that CEOs with wider faces (relative to height) tended to be associated with firms that had greater financial performance. They based their inference on an equation that uses facial WHR to pre- did financial performance. Suppose an analyst wants to predict the financial performance of a Fortune 500 firm based on the value of the true mean facial WHR of CEO&. The analyst wants to use the value of a - 2.2. Do you recommend he use this value?Packaging of a children's health food. Junk foods (e.g.. potato chips) are typically packaged to appeal to children. Can similar packaging of a healthy food product influence children's desire to consume the product? This was the question of interest in an article published in the Journal of Consumer Behaviour (Vol. 10. 2011). A fictitious brand of a healthy food product-sliced apples -was packaged to appeal to children (a smiling cartoon apple on the front of the package). The researchers showed the packaging to a sample of 408 schoolchildren and asked each whether he or she was willing to eat the product. Willingness to eat was measured on a 5-point scale, with 1 = "not willing at all" and 5 = "very willing." The data are summarized as follows: T = 3.69, x = 2.44, Suppose the researchers know that the mean willingness to eat an actual brand of sliced apples (which is not packaged for children) is A - 3. a. Conduct a test to determine whether the true mean willingness to eat the brand of sliced apples packaged for children exceeds 3. Use a = (is to make your conclusion. b. The data (willingness to eat values) are not normally distributed. How does this affect (if at all) the validity of your conclusion in part a? Explain.Dating and disclosure. Refer to the Journal of Adolescence (April 2010) study of adolescents' disclosure of their dating and romantic relationships. Recall that a sample of 222 high school students was recruited to participate in the study. One of the variables of interest was the level of disclosure to an adolescent's mother (measured on a 5-point scale, where 1 = *never tell," 2 ="rarely tell," 3 = "sometimes tell," 4 ="almost always tell," and 5 = "always tell"). The sampled high school students had a mean disclosure score of 3.20 and a standard deviation of 93. The researchers hypothesize that the true mean disclosure score of all adolescents will exceed 3. Do you believe the researchers? Conduct a formal test of hypothesis using o = .01 Dating and disclosure. As an adolescent, did you voluntarily disclose information about dating and romantic relationships to your parents? This was the research question of interest in the Journal of Adolescence (Apr. 2010). A sample of 222 high school students was recruited to participate in the study. Some of the many variables measured on each student were age (years). gender, dating experience (number of dates), and the extent to which the student was willing to tell his/her parent (without being asked) about a dating issue (e.g., how late the daters stayed out). The responses for the last variable were categorized as "never tell," "rarely tell," "sometimes tell," "almost always tell," and "always tell." a. Identify the data type for each variable. b. The study was unclear on exactly how the sample of students was selected, stating only that "participants were recruited from health or government classes in a primarily European American middle-class school district." Based on this information, what are the potential caveats to using the sample to make inferences on dating and disclosure to parents for all high school students?Birth order and IQ. An international team of economists investigated the possible link between 10 and birth order in CESifo Economic Studies (Vol. 57, 2011). The data source for the research was the Medical Birth Registry of Norway. It is known that the mean IQ (measured in stanines) for all Norway residents is 5.2 points. In the study, a sample of 581 Norway residents who were the 6th-born or later in their families had a mean IQ score of 4.7 points with a standard deviation of 1.8 points. Is this sufficient evidence to conclude that the mean IQ score of all Norway residents who were the 6th-born or later in their families is lower than the country mean of 5.2 points? Use w= 01 as a measure of reliability for your inference.Bone fossil study. Humerus bones from the same species of animal tend to have approximately the same lengthto-width ratios. When fossils of humerus bones are discovered, archeologists can often determine the species of animal by examining the length-to-width ratios of the bones. It is known that species A exhibits a mean ratio of 8.5. Suppose 41 fossils of humerus bones were unearthed at an archeological site in East Africa, where species A is believed to have lived. (Assume that the unearthed bones were all from the same unknown species.) The length-towidth ratios of the bones are listed in the following table and saved in the BONES file. 10.73 8.80 9.07 9.20 10.33 0.98 0.84 9.50 8.48 8.71 9.57 9.20 9.94 8.07 8.37 6.85 8.52 8.87 6.23 19.41 6.86 9.35 8.86 9.93 8.91 11.77 10.48 10.30 |9.30 8.17 9.80 8.17 8.93 8.80 10.02 8.38 11 67 8.30 9.17 12.00 9.38 a. Test whether the population mean ratio of all bones of this particular species differs from 8.5. Use a = .01. b. What are the practical implications of the test you conducted in part a ?Cooling method for gas turbines. During periods of high demand for electricity-especially in the hot summer months-the power output from a gas turbine engine can drop dramatically. One way to counter this drop in power is by cooling the inlet air to the turbine. An increasingly popular cooling method uses high-pressure inlet fogging. The performance of a sample of 87 gas turbines augmented with high-pressure inlet fogging was investigated in the Joumal of Engineering for Gas Turbines and Power (Jan. 2005). One measure of performance is heat rate (kilojoules per kilowatt per hour). Heat rates for the 67 gas turbines, saved in the GASTURBINE file, are listed in the next table. Suppose that a standard gas turbine has, on average, a heat rate of 10,000 kJ/kWh. a. Conduct a test to determine whether the mean heat rate of gas turbines augmented with high- pressure inlet fogging exceeds 10,000 kJ/kWh. Use a =_05. b. Identify a Type I error for this study. Identify a Type II error. 14822 13198 11948 11289 11964 10526 10387 10592 10480 | 10088 14828 13398 11726 11252 12449 11030 10787 10603 10144 11874 11510 10946 10508 10604 10270 |10529 10380 14796 12913 12270 11842 10656 11380 11136 10814 13523 11289 11183 10951 8722 10481 9812 9569 9643 9115 9115 11588 10888 9738 9295 9421 9105 10233 10186 9018 |9209 9532 9933 9152 9295 16243 14628 12786 8714 9469 11948 12414
