Answered step by step
Verified Expert Solution
Link Copied!

Question

1 Approved Answer

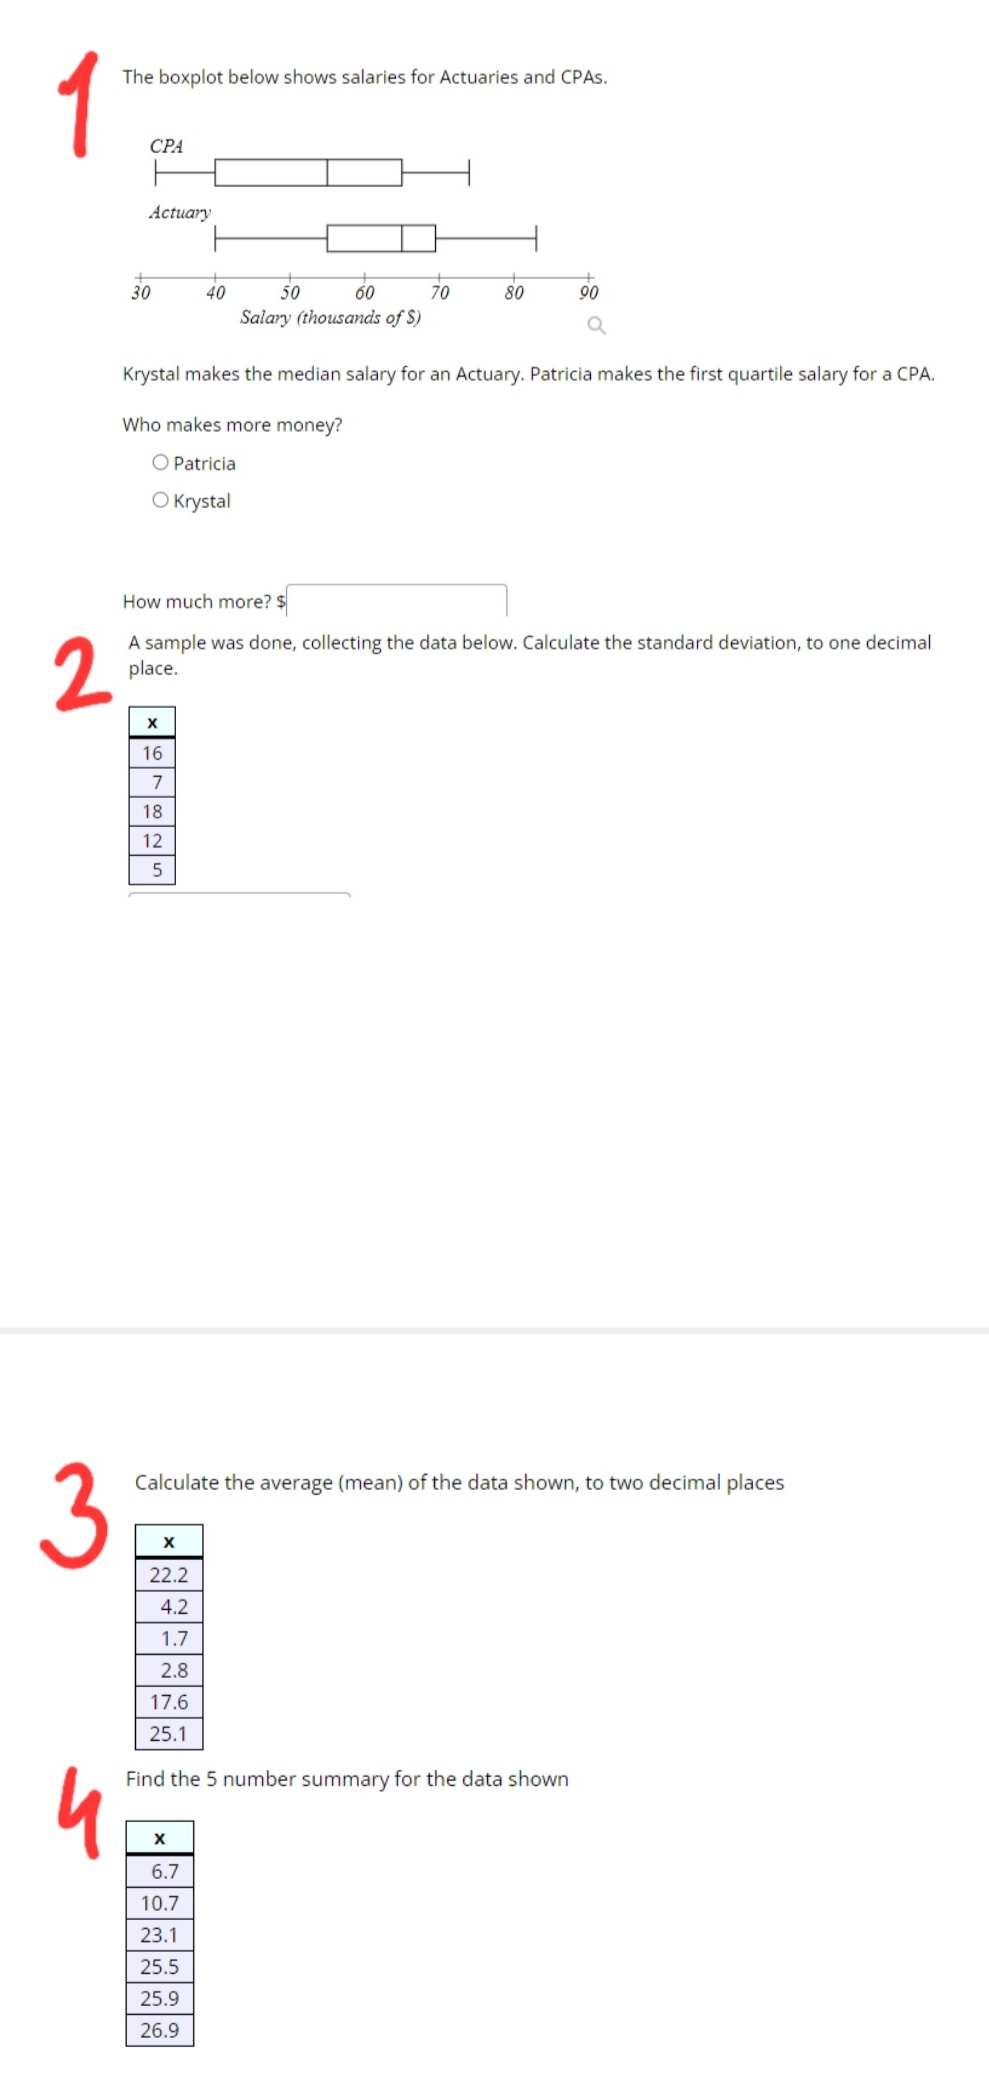
Statistics and Probability The boxplot below shows salaries for Actuaries and CPAs. CPA Actuary 30 40 50 60 70 80 90 Salary (thousands of $)

image text in transcribed

Statistics and Probability

image text in transcribed
The boxplot below shows salaries for Actuaries and CPAs. CPA Actuary 30 40 50 60 70 80 90 Salary (thousands of $) Q Krystal makes the median salary for an Actuary. Patricia makes the first quartile salary for a CPA. Who makes more money? O Patricia O Krystal How much more? $ 2 A sample was done, collecting the data below. Calculate the standard deviation, to one decimal place. X 16 7 18 12 5 Calculate the average (mean) of the data shown, to two decimal places X 22.2 4.2 1.7 2.8 17.6 25.1 Find the 5 number summary for the data shown X 6.7 10.7 23.1 25.5 25.9 26.9

Step by Step Solution

There are 3 Steps involved in it

Step: 1

blur-text-image

Get Instant Access to Expert-Tailored Solutions

See step-by-step solutions with expert insights and AI powered tools for academic success

Step: 2

blur-text-image

Step: 3

blur-text-image

Ace Your Homework with AI

Get the answers you need in no time with our AI-driven, step-by-step assistance

Get Started

Recommended Textbook for

Understanding Analysis

Authors: Stephen Abbott

1st Edition

6610189684, 9786610189687

More Books

Students also viewed these Mathematics questions

Question

When is the application deadline?

Answered: 1 week ago