Answered step by step
Verified Expert Solution
Link Copied!

Question

1 Approved Answer

Statistics and probalbility The relationship between two variables, X and Y were studied using regression analysis. The X is the independent variable whereas Y is

Statistics and probalbility
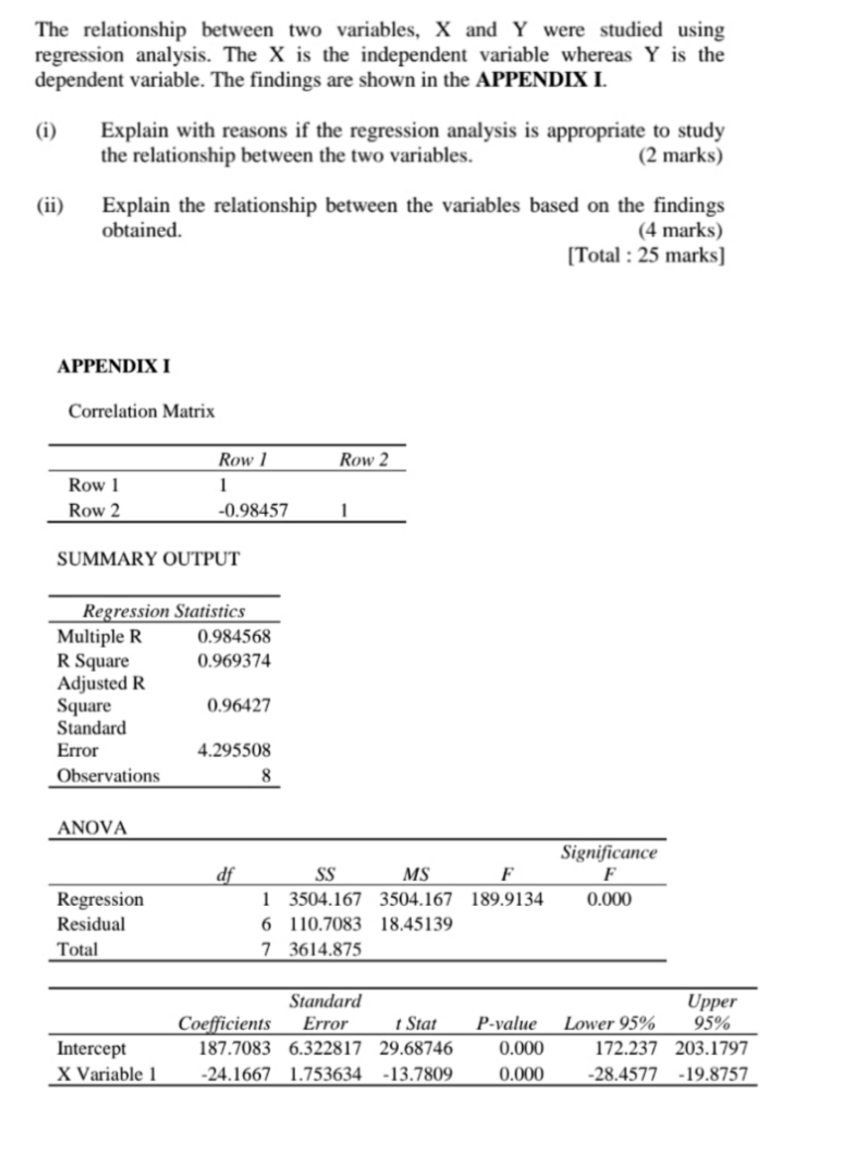
image text in transcribed
The relationship between two variables, X and Y were studied using regression analysis. The X is the independent variable whereas Y is the dependent variable. The findings are shown in the APPENDIX I. (i) Explain with reasons if the regression analysis is appropriate to study the relationship between the two variables. (2 marks) (ii) Explain the relationship between the variables based on the findings obtained. (4 marks) [Total : 25 marks] APPENDIX I Correlation Matrix Row 1 Row 2 Row 1 1 Row 2 -0.98457 SUMMARY OUTPUT Regression Statistics Multiple R 0.984568 R Square 0.969374 Adjusted R Square 0.96427 Standard Error 4.295508 Observations 8 ANOVA Significance df SS MS F F Regression 1 3504.167 3504.167 189.9134 0.000 Residual 6 110.7083 18.45139 Total 7 3614.875 Standard Upper Coefficients Error t Stat P-value Lower 95% 95% Intercept 187.7083 6.322817 29.68746 0.000 172.237 203.1797 X Variable 1 -24.1667 1.753634 -13.7809 0.000 -28.4577 -19.8757

Step by Step Solution

There are 3 Steps involved in it

Step: 1

blur-text-image

Get Instant Access to Expert-Tailored Solutions

See step-by-step solutions with expert insights and AI powered tools for academic success

Step: 2

blur-text-image

Step: 3

blur-text-image

Ace Your Homework with AI

Get the answers you need in no time with our AI-driven, step-by-step assistance

Get Started

Recommended Textbook for

Elementary Algebra

Authors: Charles P McKeague

3rd Edition

1483263843, 9781483263847

More Books

Students also viewed these Mathematics questions

Question

Contrast neurotransmitters, neuropeptides, and hormones.

Answered: 1 week ago