STATISTICS ANOVA, ANCOVA, REGRESSION Directions: Answer the following questions inside the picture and choose the correct answer. Explain why it is the correct answer. All
STATISTICS
ANOVA, ANCOVA, REGRESSION
Directions: Answer the following questions inside the picture and choose the correct answer. Explain why it is the correct answer. All the details for the question, is indicated in the pictures.
1.
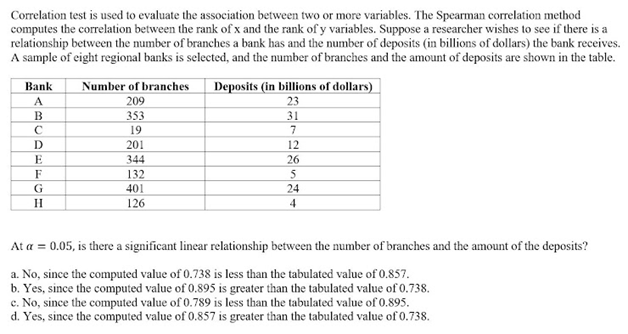
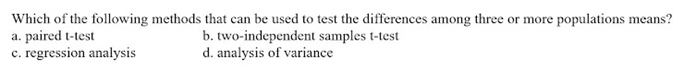
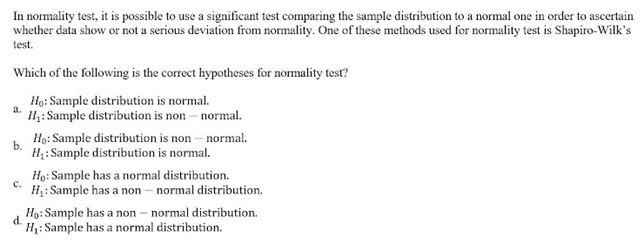
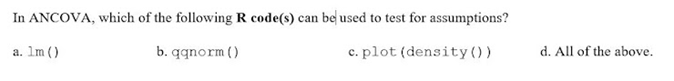
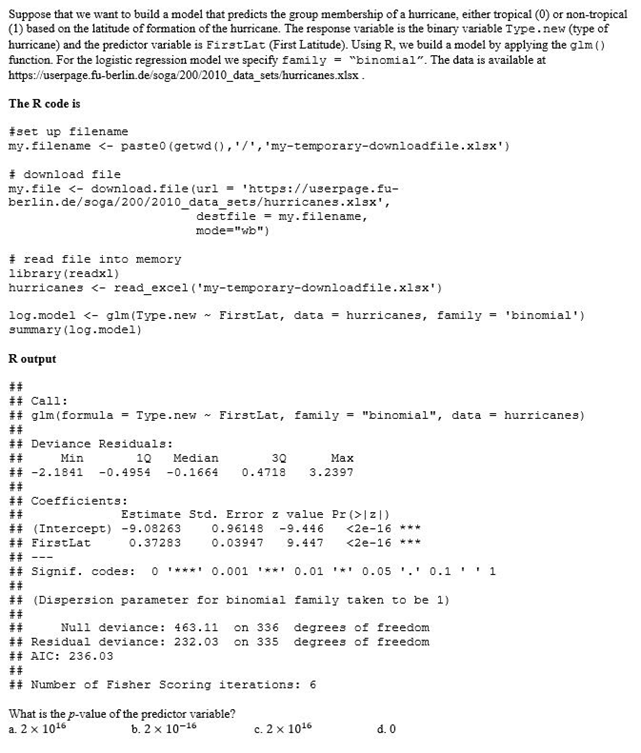
Correlation test is used to evaluate the association between two or more variables. The Spearman correlation method computes the correlation between the rank of x and the rank of y variables. Suppose a researcher wishes to see if there is a relationship between the number of branches a bank has and the number of deposits (in billions of dollars) the bank receives. A sample of eight regional banks is selected, and the number of branches and the amount of deposits are shown in the table. Bank Number of branches Deposits (in billions of dollars) A 209 23 B 353 31 C 19 D 201 12 344 26 132 5 401 24 HI 126 4 At ar = 0.05, is there a significant linear relationship between the number of branches and the amount of the deposits? a. No, since the computed value of 0.738 is less than the tabulated value of 0.857. b. Yes, since the computed value of 0.895 is greater than the tabulated value of 0.738. c. No, since the computed value of 0.789 is less than the tabulated value of 0.895. d. Yes, since the computed value of 0.857 is greater than the tabulated value of 0.738.Which of the following methods that can be used to test the differences among three or more populations means? a. paired t-test b. two-independent samples t-test c. regression analysis d. analysis of varianceIn normality test, it is possible to use a significant test comparing the sample distribution to a normal one in order to ascertain whether data show or not a serious deviation from normality. One of these methods used for normality test is Shapiro-Wilk's test. Which of the following is the correct hypotheses for normality test? Ho: Sample distribution is normal. a. H1: Sample distribution is non - normal. Ho: Sample distribution is non - normal. b. H : Sample distribution is normal. Ho: Sample has a normal distribution. "H, : Sample has a non - normal distribution. Ho: Sample has a non - normal distribution. d. H : Sample has a normal distribution.In ANCOVA, which of the following R code(s) can be used to test for assumptions? a. lm () b. qqnorm () c. plot (density () ) d. All of the above.Suppose that we want to build a model that predicts the group membership of a hurricane, either tropical (0) or non-tropical (1) based on the latitude of formation of the hurricane. The response variable is the binary variable Type. new (type of hurricane) and the predictor variable is FirstLat (First Latitude). Using R, we build a model by applying the gim () function. For the logistic regression model we specify family = "binomial". The data is available at https://userpage.fu-berlin.de/soga/200/2010_data_sets/hurricanes.xisx . The R code is #set up filename my . filename |2|) (Intercept) -9.08263 0. 96148 -9. 446
Step by Step Solution
There are 3 Steps involved in it
Step: 1
Get Instant Access to Expert-Tailored Solutions
See step-by-step solutions with expert insights and AI powered tools for academic success
Step: 2
Step: 3
Ace Your Homework with AI
Get the answers you need in no time with our AI-driven, step-by-step assistance