

Answered step by step
Verified Expert Solution
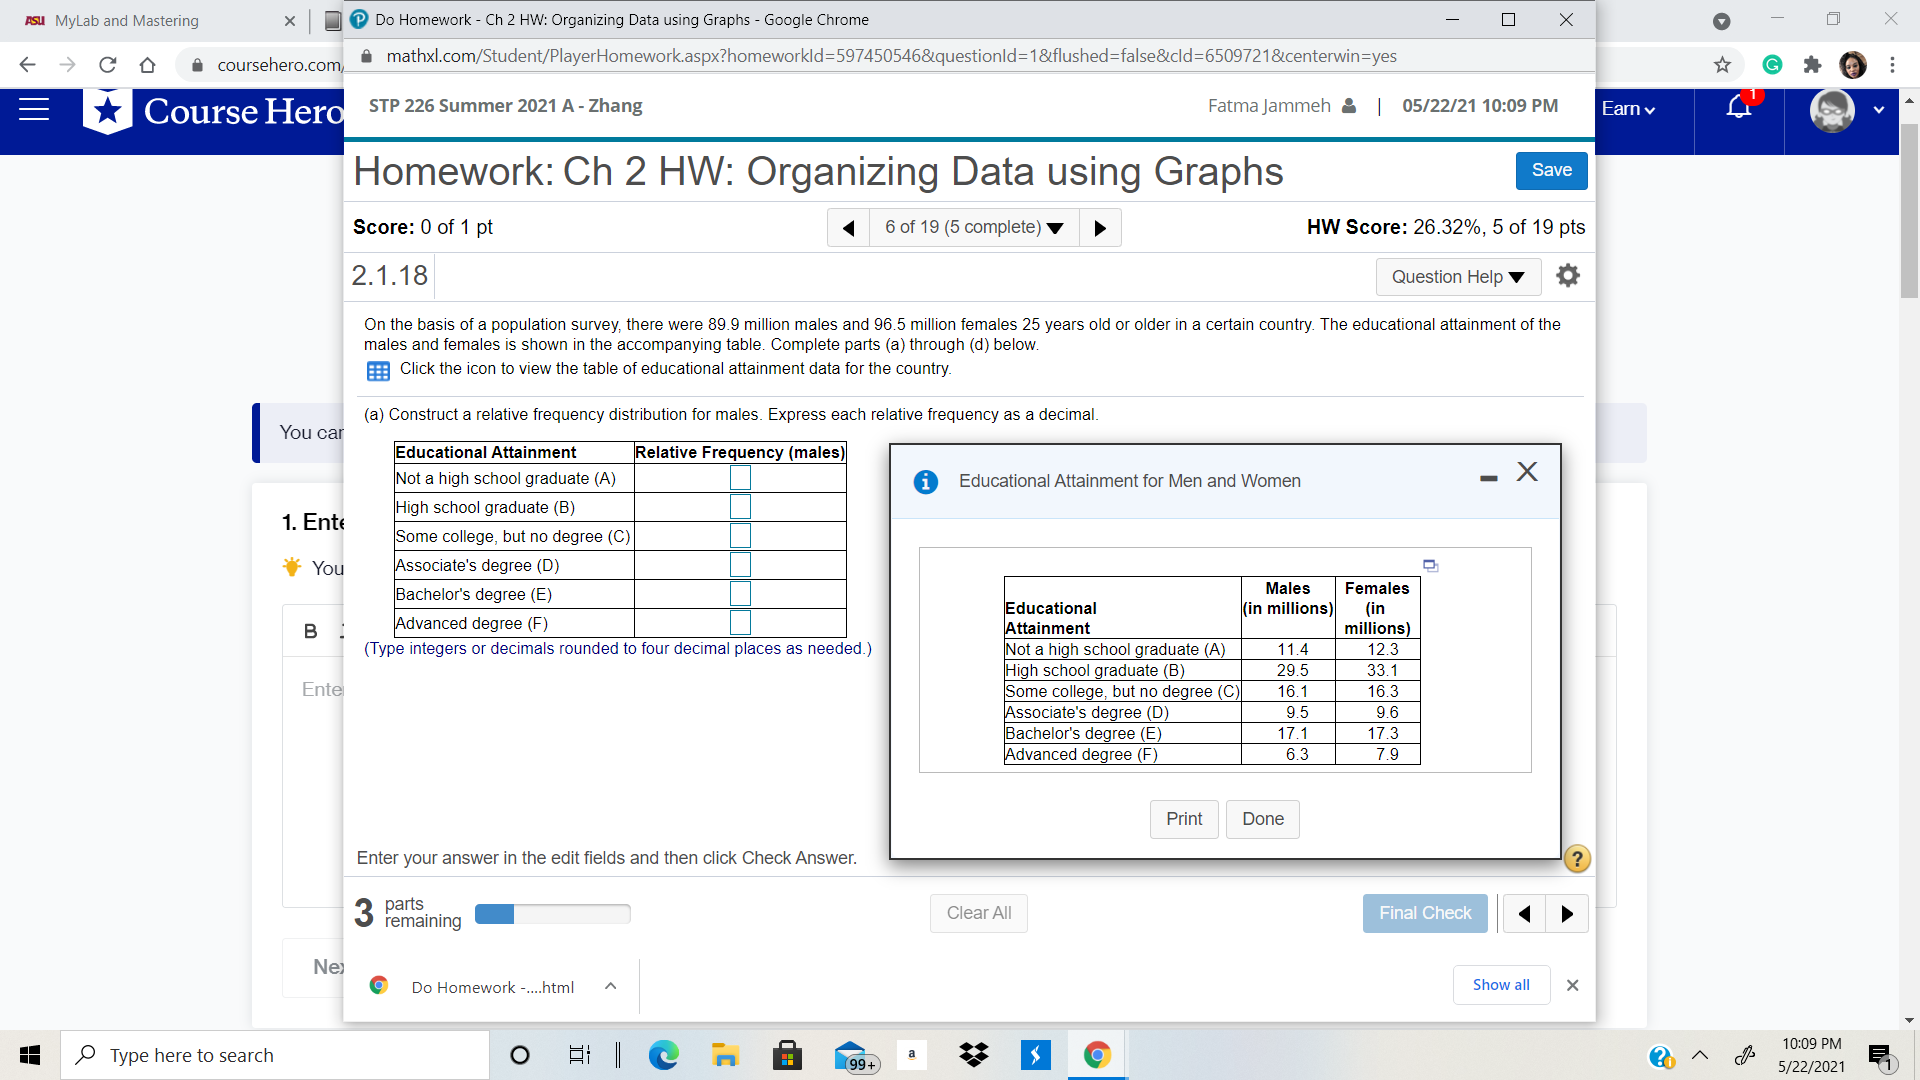
Question
1 Approved Answer
Statistics ASU MyLab and Mastering x Do Homework - Ch 2 HW: Organizing Data using Graphs - Google Chrome - X X F- CD coursehero.com,
Statistics
Step by Step Solution
There are 3 Steps involved in it
Step: 1

Get Instant Access to Expert-Tailored Solutions
See step-by-step solutions with expert insights and AI powered tools for academic success
Step: 2

Step: 3
Ace Your Homework with AI
Get the answers you need in no time with our AI-driven, step-by-step assistance
Get Started
An Introduction to the Mathematics of financial Derivatives
Authors: Salih N. Neftci
2nd Edition
978-0125153928, 9780080478647, 125153929, 978-0123846822