Answered step by step
Verified Expert Solution
Link Copied!

Question

1 Approved Answer

Statistics Complete the chai-square goodness of fit table on the Excel spreadsheet. What can we conclude from the results of the chai-square goodness of fit?

Statistics
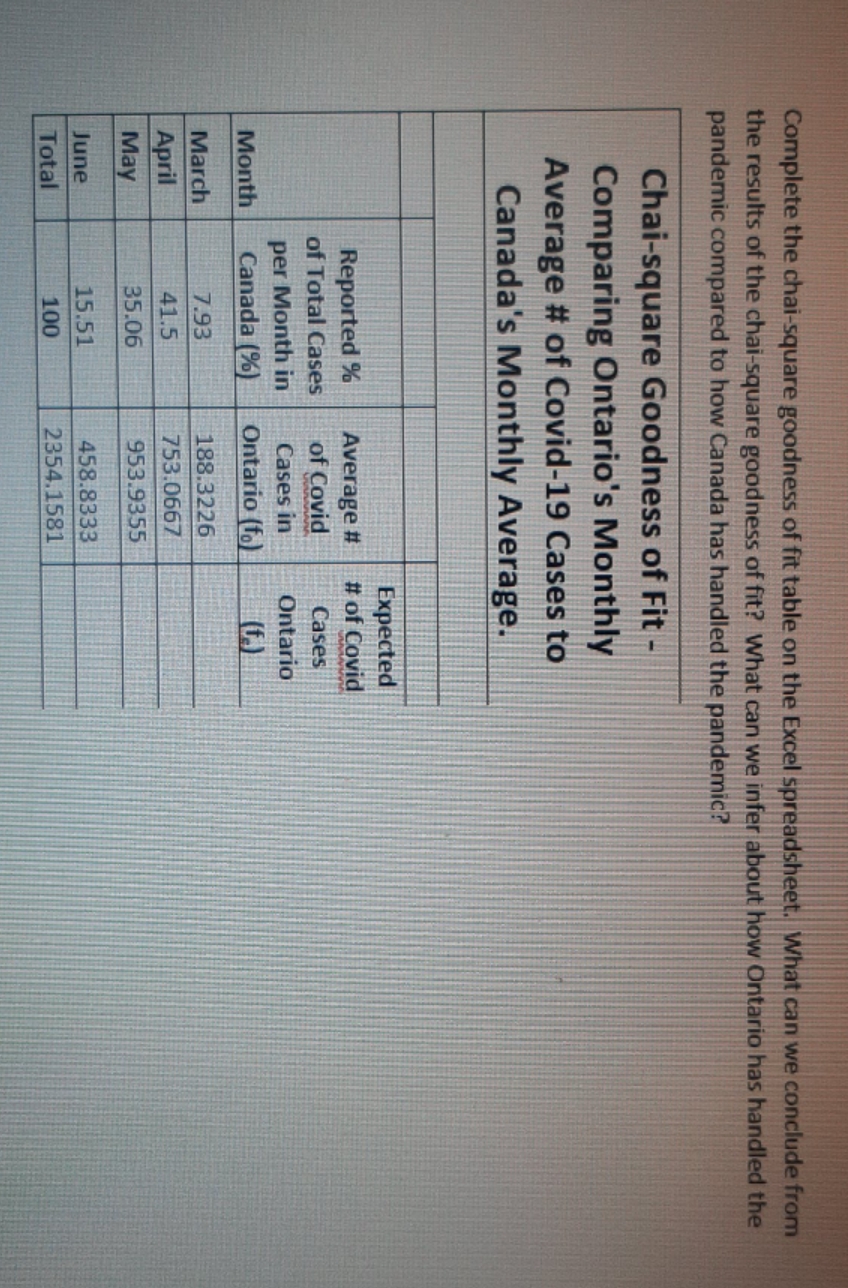
image text in transcribed
Complete the chai-square goodness of fit table on the Excel spreadsheet. What can we conclude from the results of the chai-square goodness of fit? What can we infer about how Ontario has handled the pandemic compared to how Canada has handled the pandemic? Chai-square Goodness of Fit - Comparing Ontario's Monthly Average # of Covid-19 Cases to Canada's Monthly Average. Expected Reported % Average # # of Covid of Total Cases of Covid Cases per Month in Cases in Ontario Month Canada (%) Ontario (fo) March 7.93 188.3226 April 41.5 753.0667 May 35.06 953.9355 June 15.51 458.8333 Total 100 2354.1581

Step by Step Solution

There are 3 Steps involved in it

Step: 1

blur-text-image

Get Instant Access to Expert-Tailored Solutions

See step-by-step solutions with expert insights and AI powered tools for academic success

Step: 2

blur-text-image

Step: 3

blur-text-image

Ace Your Homework with AI

Get the answers you need in no time with our AI-driven, step-by-step assistance

Get Started

Recommended Textbook for

Holt Algebra 1 Ohio

Authors: Edward B. Burger, Holt, Rinehart And Winston

Student Edition

0030932947, 978-0030932946

More Books

Students also viewed these Mathematics questions