Answered step by step
Verified Expert Solution
Question
1 Approved Answer
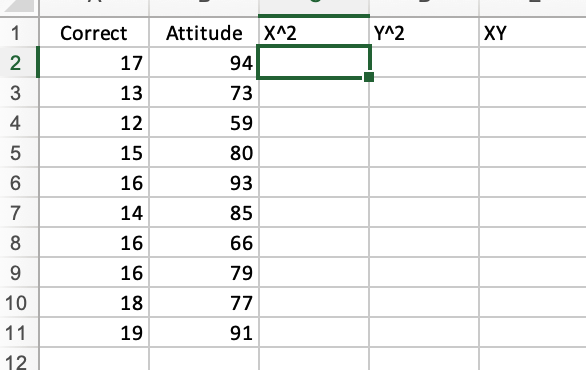
Statistics for People Who (Think They)Hate Statistics Using Microsoft Excel 2016 4th Edition: Given Chapter 5 Data Set 1. Use the data to answer Questions
Statistics for People Who (Think They)Hate Statistics Using Microsoft Excel 2016 4th Edition: Given Chapter 5 Data Set 1.
Use the data to answer Questions 1a and 1b.
1a. Compute the Pearson product-moment correlation coefficient by hand and show all your work.
1b. Construct a scatterplot for these 10 values by hand. Based on the scatterplot, would you predict the correlation to be direct or indirect? Why?

Step by Step Solution
There are 3 Steps involved in it
Step: 1

Get Instant Access to Expert-Tailored Solutions
See step-by-step solutions with expert insights and AI powered tools for academic success
Step: 2

Step: 3

Ace Your Homework with AI
Get the answers you need in no time with our AI-driven, step-by-step assistance
Get Started


