Question
Statistics for People Who (Think They)Hate Statistics Using Microsoft Excel 2016 4th Edition: Given Chapter 5 Data Set 1. Use Excel to solve Chapter 5
Statistics for People Who (Think They)Hate Statistics Using Microsoft Excel 2016 4th Edition: Given Chapter 5 Data Set 1. Use Excel to solve Chapter 5 Question 1. Completely label the output. Prepare a document explaining the statistical process and the results.
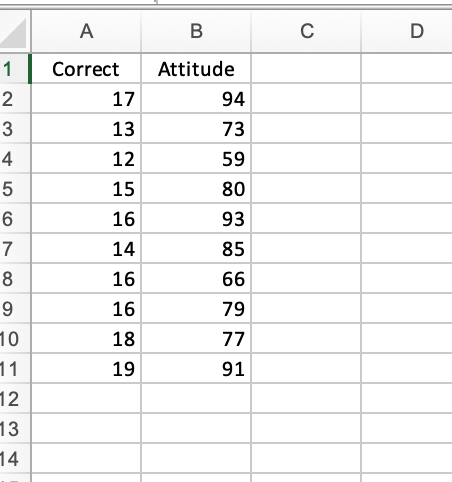
Use the Data set to answer questions 1a and 1b. These data are saved as Chapter 5, Data Set 1.
1a. Compute the Pearson product-moment correlation coefficient by hand and show all your work.
1b. Construct a scatterplot for these 10 values by hand. Based on the scatterplot, would you predict the correlation to be direct or indirect? Why?
Here is the data set:

Step by Step Solution
There are 3 Steps involved in it
Step: 1

Get Instant Access to Expert-Tailored Solutions
See step-by-step solutions with expert insights and AI powered tools for academic success
Step: 2

Step: 3

Ace Your Homework with AI
Get the answers you need in no time with our AI-driven, step-by-step assistance
Get Started


