Answered step by step
Verified Expert Solution
Link Copied!

Question

1 Approved Answer

Statistics Hours per day watching TV IN Valid 988 Missing 475 Mean 2.86 Median 2.00 Mode 2 Sid. Deviation 2.771 Range 24 Hours per day
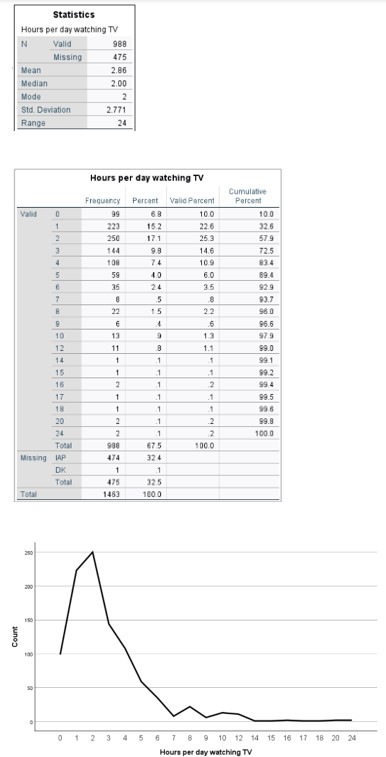
image text in transcribed
Statistics Hours per day watching TV IN Valid 988 Missing 475 Mean 2.86 Median 2.00 Mode 2 Sid. Deviation 2.771 Range 24 Hours per day watching TV Cumulative Frequency Percent Valid Percent Percent 99 10.0 10.0 15.2 22 6 32.6 250 17.1 25.3 57.9 9.8 14.6 72.5 74 109 83.4 59 1.0 6.0 89.4 24 35 92.9 93.7 15 9610 A 96.6 10 13 1.3 97.9 12 11 1.1 99.0 1 991 15 90.2 16 2 99.4 17 99.5 18 20 .1 .2 99.0 1 100 0 Toill 988 47 5 100 0 Misting MAP 474 324 DK .1 Total 325 ToLy 1483 140.0 Count 1 2 3 4 5 6 7 8 9 10 12 14 15 16 17 18 20 24 Hours per day watching TV

Step by Step Solution

There are 3 Steps involved in it

Step: 1

blur-text-image

Get Instant Access to Expert-Tailored Solutions

See step-by-step solutions with expert insights and AI powered tools for academic success

Step: 2

blur-text-image

Step: 3

blur-text-image

Ace Your Homework with AI

Get the answers you need in no time with our AI-driven, step-by-step assistance

Get Started

Recommended Textbook for

College Algebra

Authors: Margaret L. Lial, John Hornsby, David I. Schneider, Callie Daniels

12th edition

134697022, 9780134313795 , 978-0134697024

More Books

Students also viewed these Mathematics questions