Question
Statistics Island Directions For all calculations, show your work and/or explain how you used the calculator to compute. 1. Your population is thriving on your
Statistics Island
Directions
For all calculations, show your work and/or explain how you used the calculator to compute.
1. Your population is thriving on your island. The data you have collected now needs to be displayed and analyzed. Use the charts you created in the Probability Island project to complete the table below. Use the total number of births per year to fill in chart 3. Round to two decimal places if necessary
Chart 3 - Births
Mean | 3.7 |
Median | 3 |
Mode | 3 |
Range | 7 |
Standard Deviation | 1.47 |
2,3,3,3,3,3,4,4,5,7
Mean = (2+3+3+3+3+3+4+4+5+7)/10= 3.7
Median = 3(the 5th and 6th data value is 3)
Mode = 3 (there are 5 data values that are 3)
Range = 7-0= 7
Standard Deviation: ((2-3.7)2+5(3-3.7)2+2(4-3.7)2+(5-3.7)2+(7-3.7)2)/10) = 1.4696938456699 =1.47
2. Is your standard deviation for a population or a sample? Why did you select that answer?
My standard deviation is for a population, and the population is for children over the age of 10 years.
3. Find the following values using your data from chart 1 on the first project.
Chart 4
Lowest value | 2 |
First Quartile (Q1) | 3 |
Median (Q2) | 3 |
Third Quartile (Q3) | 4 |
Highest value | 7 |
Interquartile range | 1 |
4. Create a box and whisker plot using the answers from question 3. Be sure to include the number line and label it.
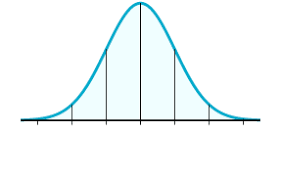
5. Label Graph 1. Using the mean and standard deviation from Chart 3, label the mean. Then label up to 3 standard deviations above and below the mean.
Graph 1


Step by Step Solution
There are 3 Steps involved in it
Step: 1

Get Instant Access to Expert-Tailored Solutions
See step-by-step solutions with expert insights and AI powered tools for academic success
Step: 2

Step: 3

Ace Your Homework with AI
Get the answers you need in no time with our AI-driven, step-by-step assistance
Get Started


