Answered step by step
Verified Expert Solution
Link Copied!

Question

1 Approved Answer

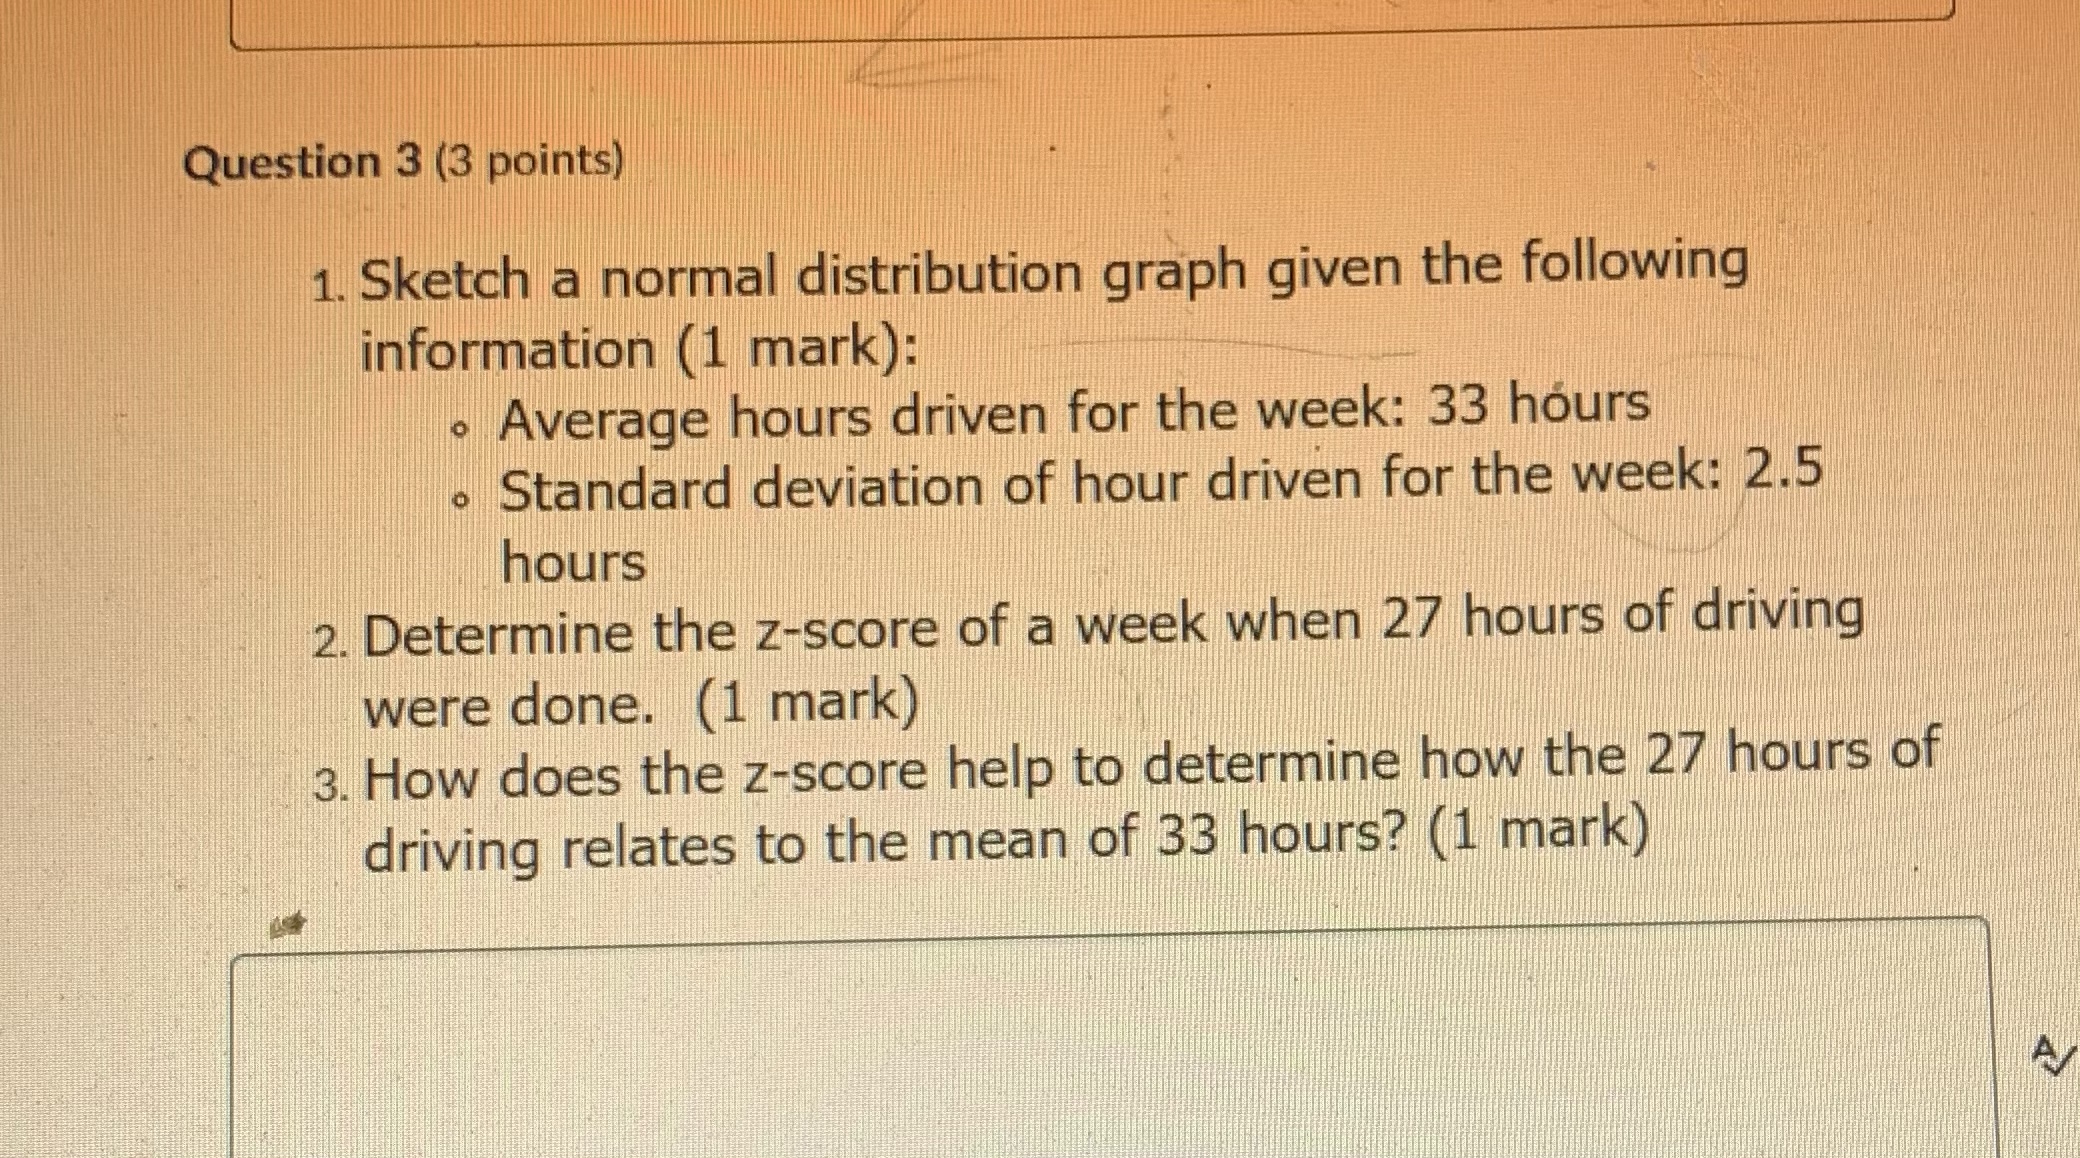
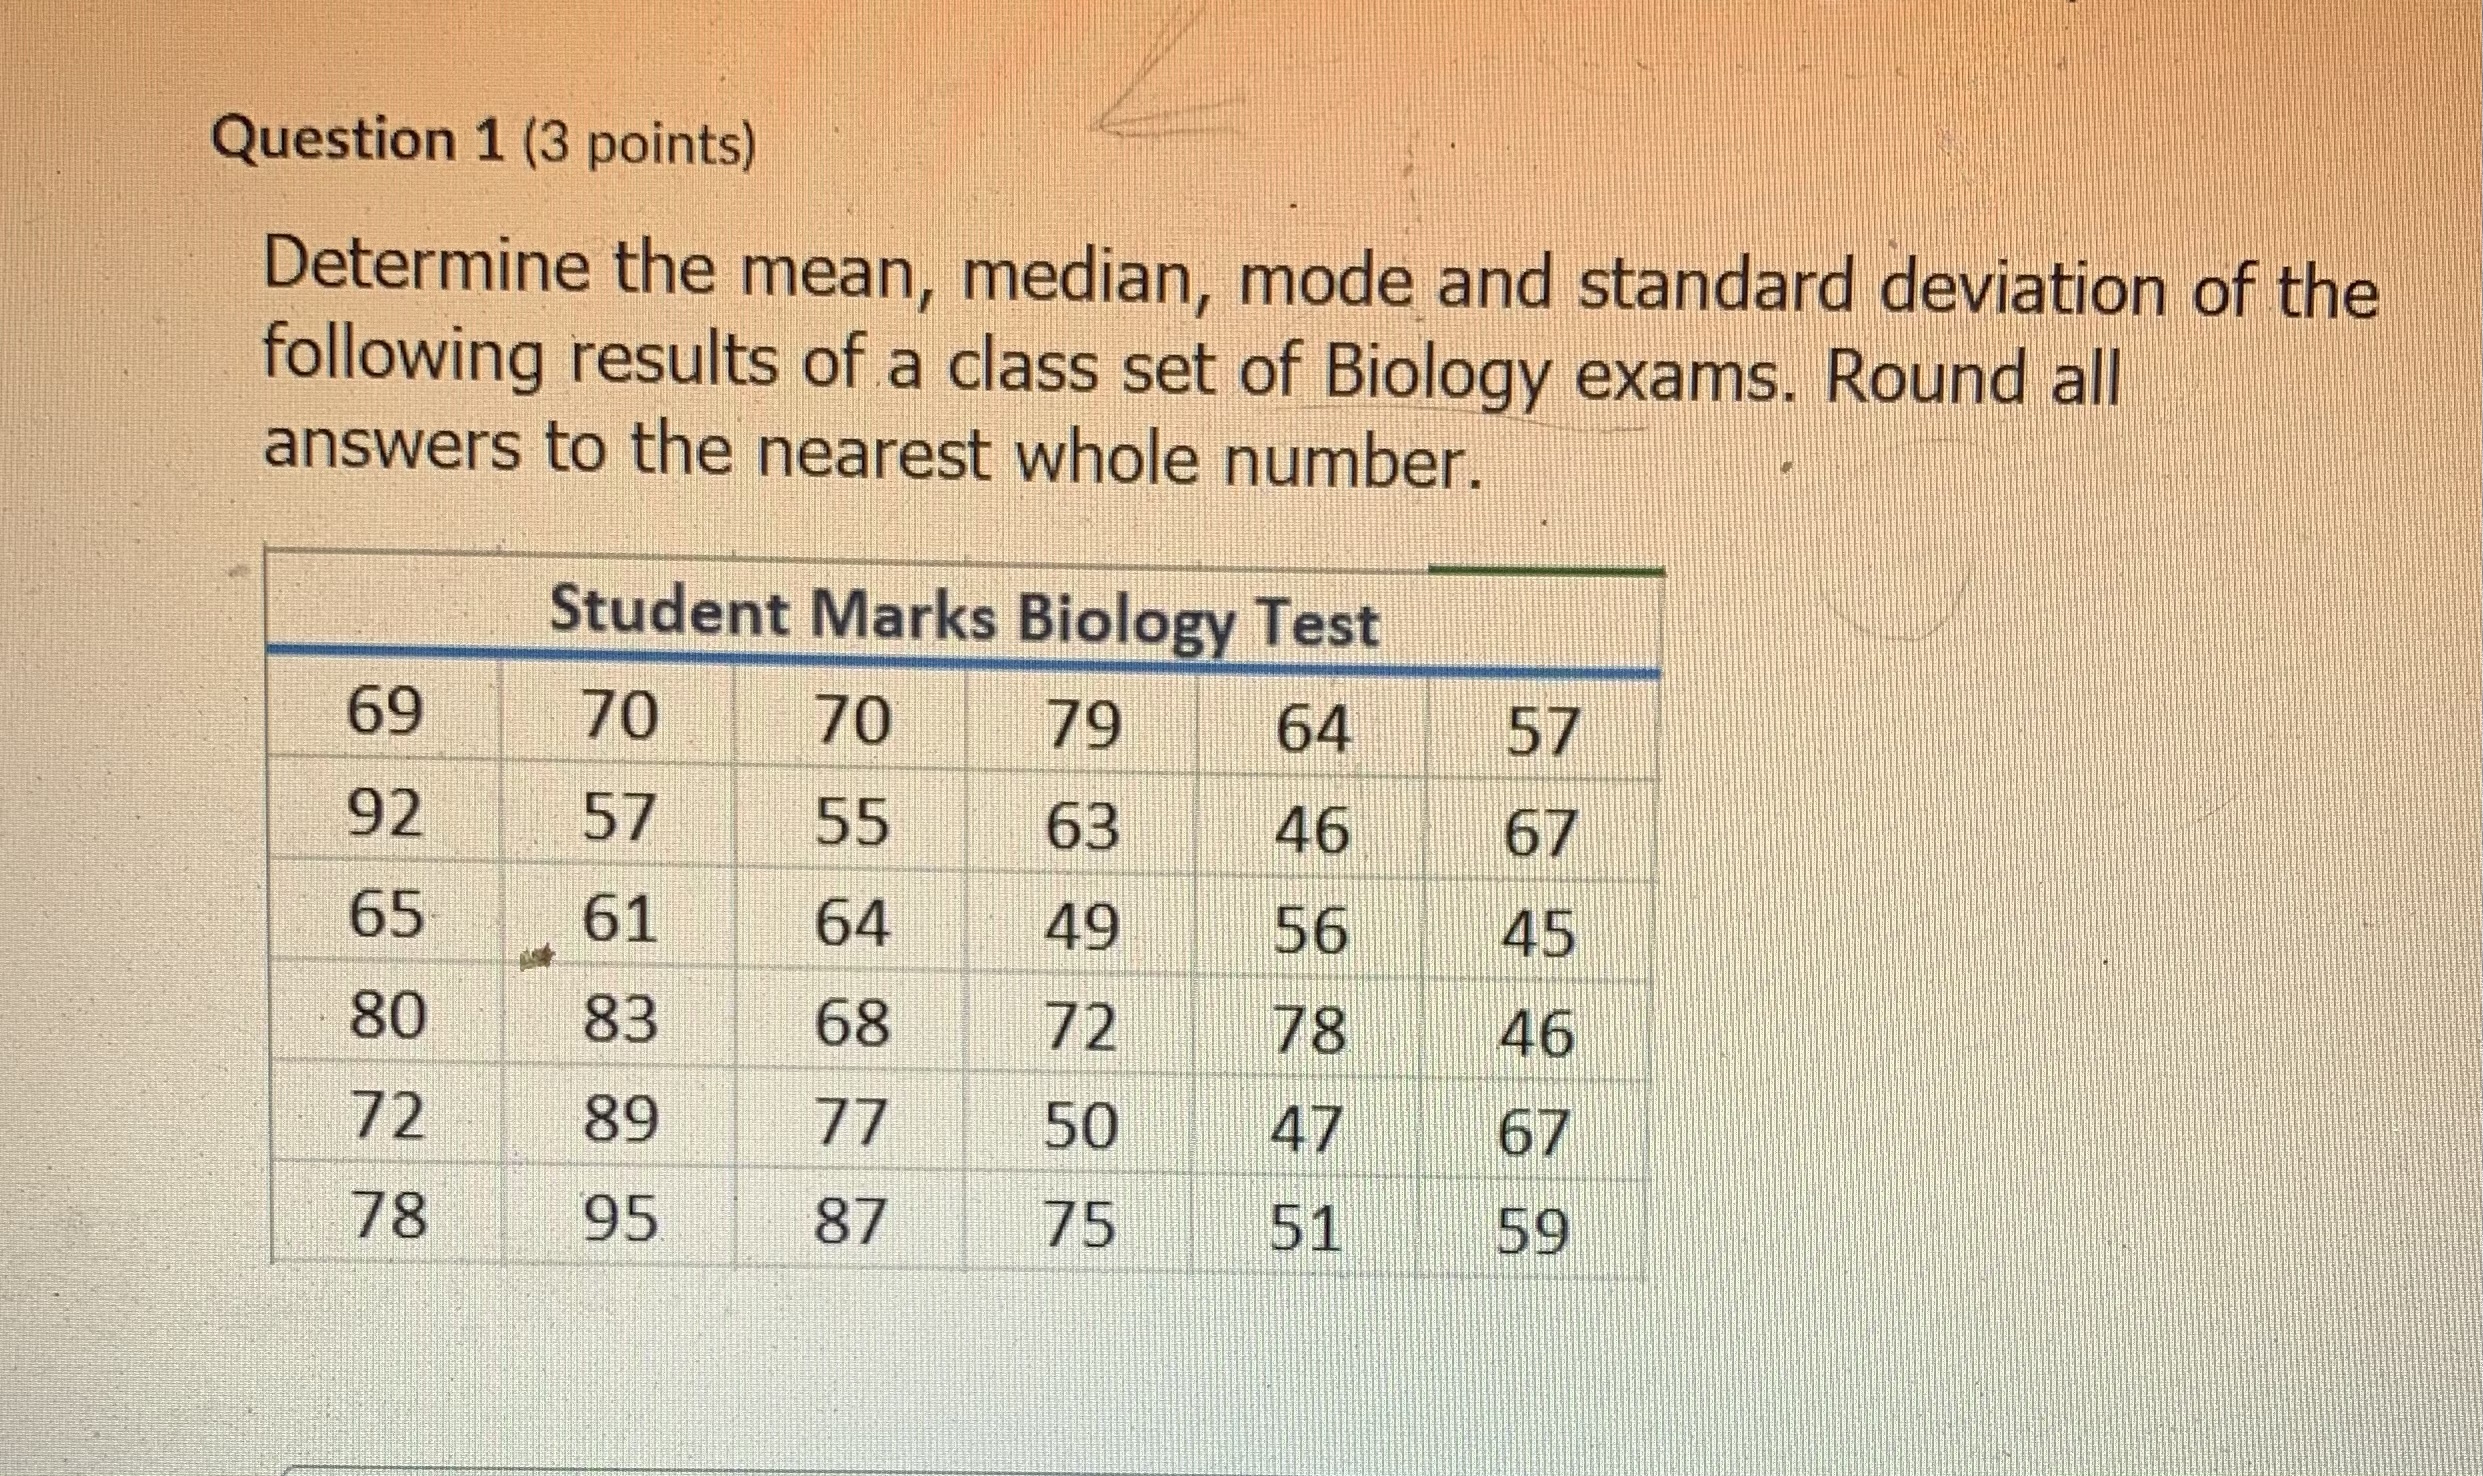
Statistics Please answer the question 1 and 3 below the attachment please show your work Question 3 (3 points) 1. Sketch a normal distribution graph

Statistics

Please answer the question 1 and 3 below the attachment please show your work

image text in transcribedimage text in transcribed
Question 3 (3 points) 1. Sketch a normal distribution graph given the following information (1 mark): . Average hours driven for the week: 33 hours . Standard deviation of hour driven for the week: 2.5 hours 2. Determine the z-score of a week when 27 hours of driving were done. (1 mark) 3. How does the z-score help to determine how the 27 hours of driving relates to the mean of 33 hours? (1 mark) AQuestion 1 (3 points) Determine the mean, median, mode and standard deviation of the following results of a class set of Biology exams. Round all answers to the nearest whole number. Student Marks Biology Test 69 70 70 79 64 57 92 57 55 63 46 67 65 61 64 49 56 45 80 83 68 72 78 46 72 89 77 50 47 67 78 95 87 75 51 59

Step by Step Solution

There are 3 Steps involved in it

Step: 1

blur-text-image

Get Instant Access to Expert-Tailored Solutions

See step-by-step solutions with expert insights and AI powered tools for academic success

Step: 2

blur-text-image

Step: 3

blur-text-image

Ace Your Homework with AI

Get the answers you need in no time with our AI-driven, step-by-step assistance

Get Started

Recommended Textbook for

Elementary Algebra

Authors: Charles P McKeague

3rd Edition

ISBN: 1483263843, 9781483263847

More Books

Students also viewed these Mathematics questions

Question

p5-1B

Answered: 1 week ago