

Question
statistics : question 13: A researcher has conducted a study analyzing the effects of different types of note-taking among her students. An ANOVA found that
statistics :
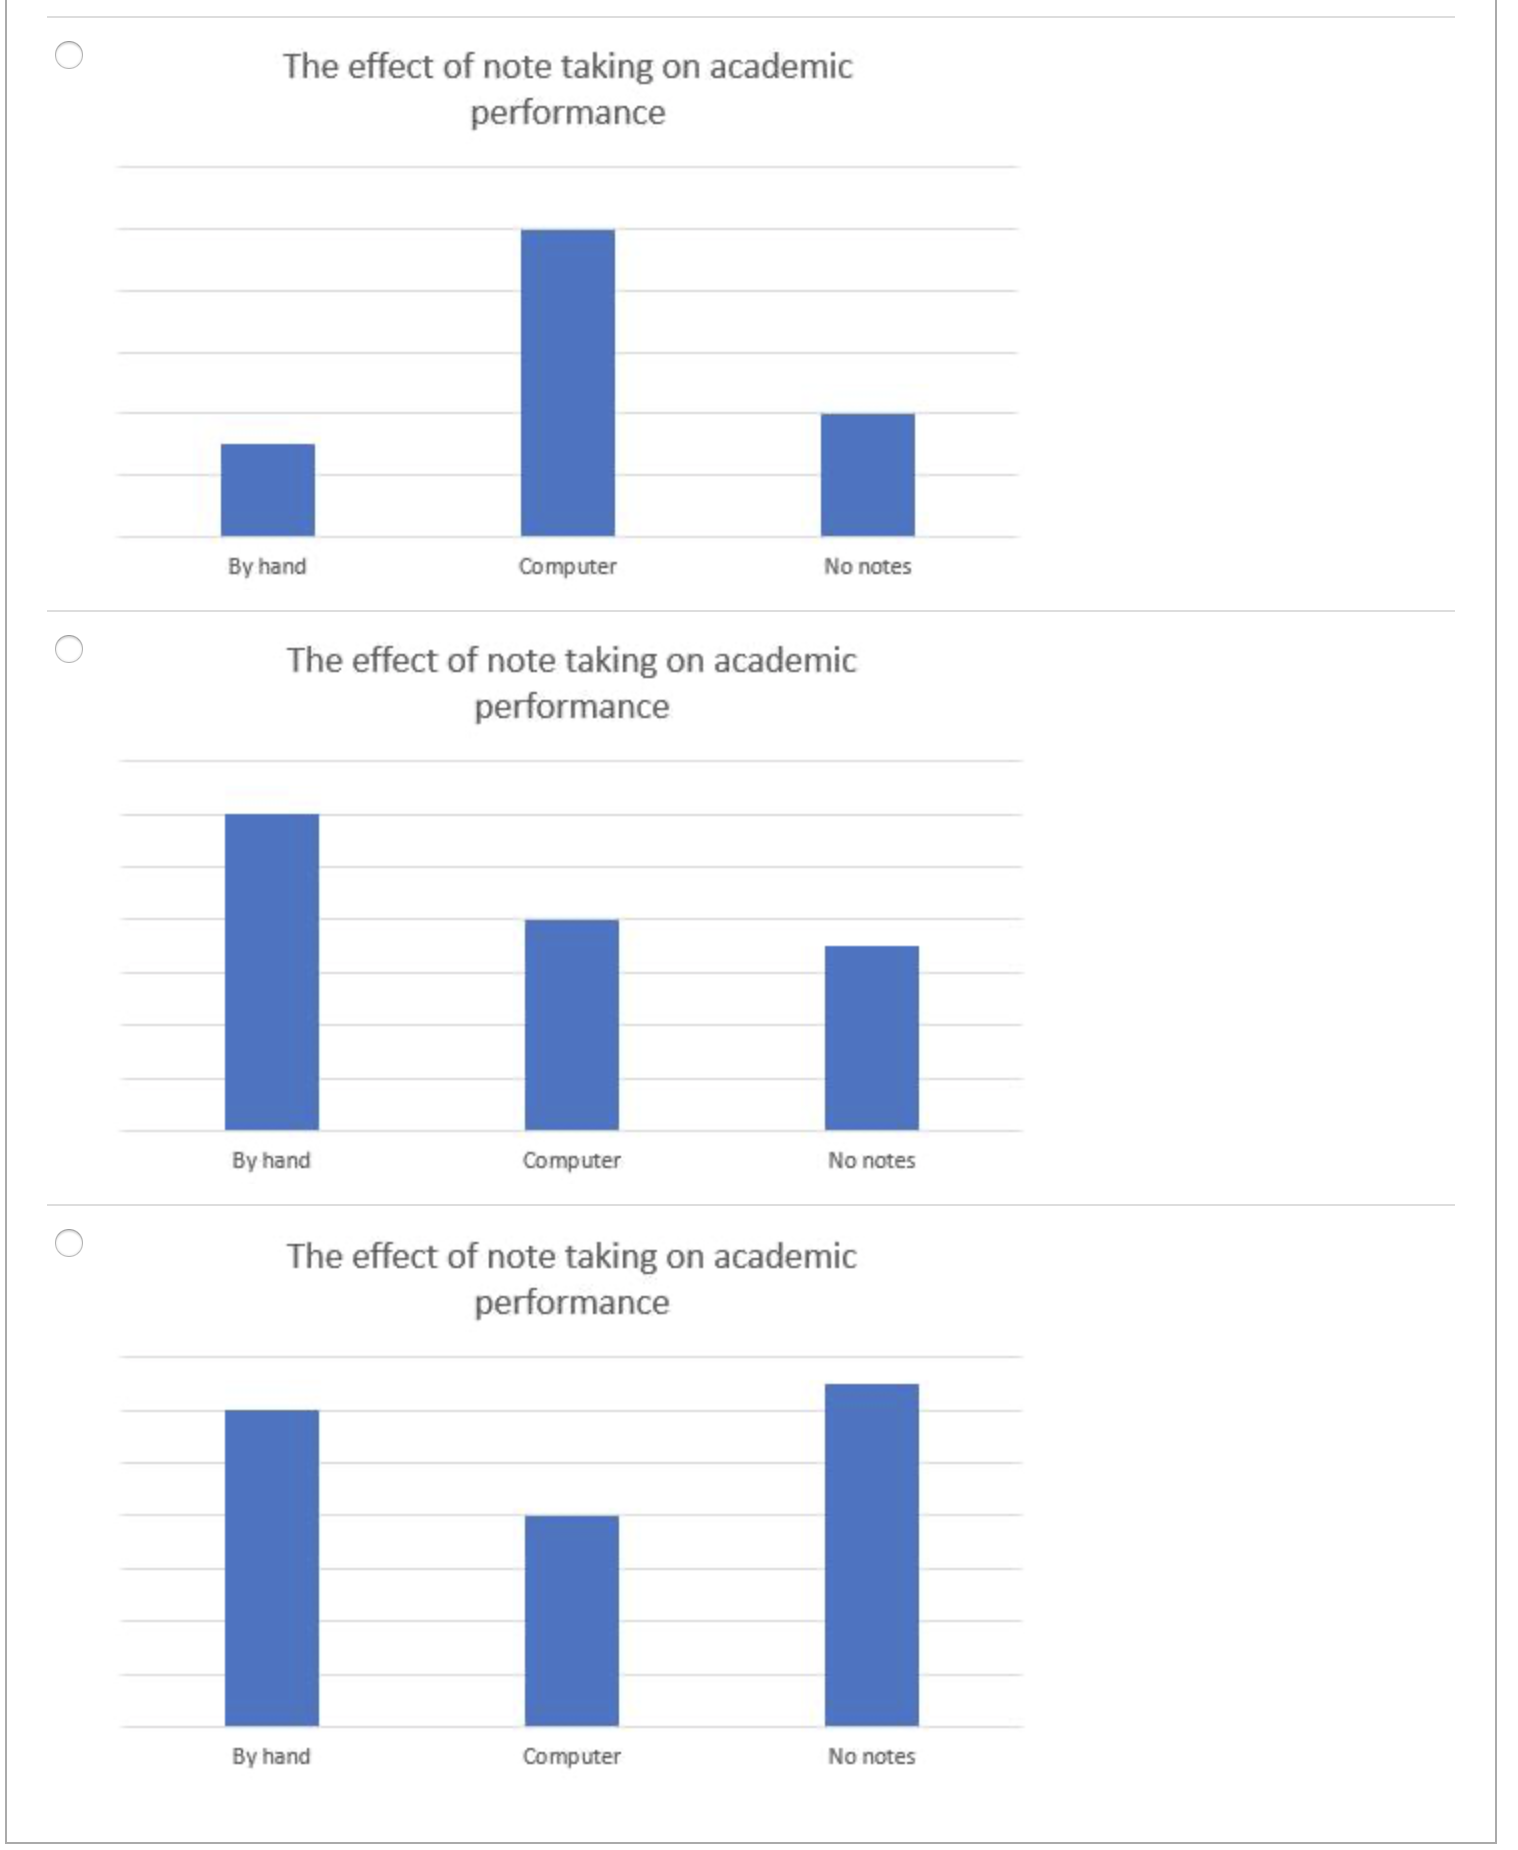
question 13: A researcher has conducted a study analyzing the effects of different types of note-taking among her students. An ANOVA found that there was some difference among three different categories of students: those who took notes by hand, those who took notes on their computer, and those who didn't take notes at all. The researcher then conducts a Bonferroni post-hoc test and found that there were significantly different grades in students who took notes by hand when compared to the others, but there were no other differences. Which graph would likely be representative of her data?
Step by Step Solution
There are 3 Steps involved in it
Step: 1

Get Instant Access to Expert-Tailored Solutions
See step-by-step solutions with expert insights and AI powered tools for academic success
Step: 2

Step: 3
Ace Your Homework with AI
Get the answers you need in no time with our AI-driven, step-by-step assistance
Get Started
Finite Mathematics
Authors: Stefan Waner, Steven Costenoble
6th Edition
1285415604, 9781285415604