

Question
STATISTICS R STUDIO HAS TO BE USED and the name of the dataset is in R and it is Titanic. There are four classes :1st,
STATISTICS
R STUDIO HAS TO BE USED and the name of the dataset is in R and it is "Titanic". There are four classes :1st, 2nd, 3rd and crew please don't forget that
(a) Fit a model with main effects, state it in statistical notation, interpret the coefficients of the model. Which variables are most important in the model?
(b) Fit a model with two way effects, state it in statistical notation, interpret the coefficients of the model. Which variables or interactions are most important in this model?
(c) Fit a model with three way effects, state it in statistical notation, interpret the coefficients of the model. Which variables or interactions are most important in this model?
(d) Fit a saturated model, state it in statistical notation, interpret the coefficients of the model. Which variables or interactions are most important in this model?
(e) Determine the model that best describe the data, state it in statistical notation, interpret the coefficients of the model. Which variables or interactions are most important in this model?
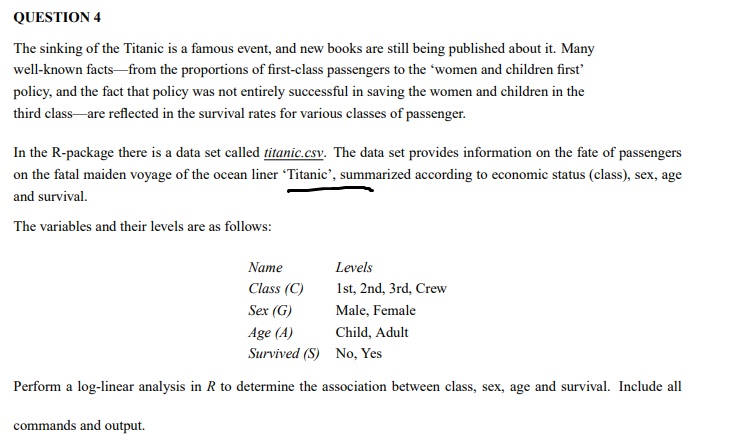
QUESTION 4 The sinking of the Titanic is a famous event, and new books are still being published about it. Many well-known factsfrom the proportions of first-class passengers to the women and children first policy, and the fact that policy was not entirely successful in saving the women and children in the third classare reflected in the survival rates for various classes of passenger. In the R-package there is a data set called titanic.csv. The data set provides information on the fate of passengers on the fatal maiden voyage of the ocean liner Titanic', summarized according to economic status (class), sex, age and survival. The variables and their levels are as follows: Name Levels Class (C) 1st, 2nd, 3rd, Crew Sex (G) Male, Female Age (A) Child, Adult Survived (5) No, Yes Perform a log-linear analysis in R to determine the association between class, sex, age and survival. Include all commands and output. QUESTION 4 The sinking of the Titanic is a famous event, and new books are still being published about it. Many well-known factsfrom the proportions of first-class passengers to the women and children first policy, and the fact that policy was not entirely successful in saving the women and children in the third classare reflected in the survival rates for various classes of passenger. In the R-package there is a data set called titanic.csv. The data set provides information on the fate of passengers on the fatal maiden voyage of the ocean liner Titanic', summarized according to economic status (class), sex, age and survival. The variables and their levels are as follows: Name Levels Class (C) 1st, 2nd, 3rd, Crew Sex (G) Male, Female Age (A) Child, Adult Survived (5) No, Yes Perform a log-linear analysis in R to determine the association between class, sex, age and survival. Include all commands and outputStep by Step Solution
There are 3 Steps involved in it
Step: 1

Get Instant Access to Expert-Tailored Solutions
See step-by-step solutions with expert insights and AI powered tools for academic success
Step: 2

Step: 3
Ace Your Homework with AI
Get the answers you need in no time with our AI-driven, step-by-step assistance
Get Started
Databases Illuminated
Authors: Catherine M. Ricardo
1st Edition
0763733148, 978-0763733148