Answered step by step
Verified Expert Solution
Link Copied!

Question

1 Approved Answer

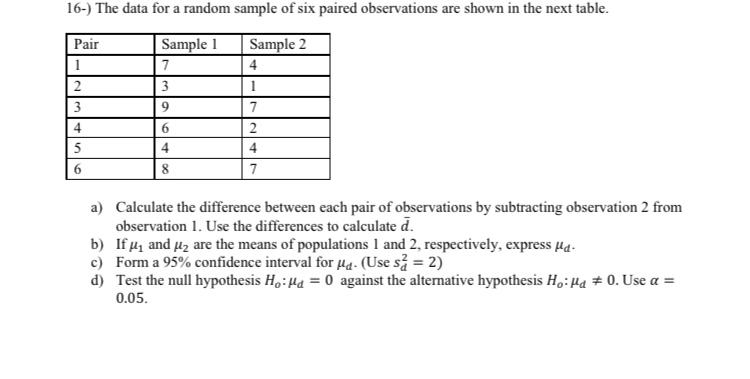
statistictis 16-) The data for a random sample of six paired observations are shown in the next table. Pair Sample 1 Sample 2 1 7

  • statistictis
    image text in transcribed
16-) The data for a random sample of six paired observations are shown in the next table. Pair Sample 1 Sample 2 1 7 4 2 3 1 3 7 4 6 2 5 4 4 6 8 7 a) Calculate the difference between each pair of observations by subtracting observation 2 from observation 1. Use the differences to calculate d. b) If #, and #2 are the means of populations 1 and 2, respectively, express ud. c) Form a 95% confidence interval for a. (Use s= = 2) d) Test the null hypothesis Ho: Ha = 0 against the alternative hypothesis Ho: Ha # 0. Use a = 0.05

Step by Step Solution

There are 3 Steps involved in it

Step: 1

blur-text-image

Get Instant Access to Expert-Tailored Solutions

See step-by-step solutions with expert insights and AI powered tools for academic success

Step: 2

blur-text-image

Step: 3

blur-text-image

Ace Your Homework with AI

Get the answers you need in no time with our AI-driven, step-by-step assistance

Get Started

Recommended Textbook for

Accounting Information Systems

Authors: Jr Ulric J Gelinas, Ulric J Gelinas, Richard B Dull

8th Edition

0324663803, 9780324663808

More Books

Students also viewed these Mathematics questions

Question

Prove that (R 2 , U) is second countable.

Answered: 1 week ago

Question

What is population?

Answered: 1 week ago

Question

Explain the study in demography?

Answered: 1 week ago

Question

Define social demography?

Answered: 1 week ago

Question

What is migration?

Answered: 1 week ago