Answered step by step
Verified Expert Solution
Link Copied!

Question

1 Approved Answer

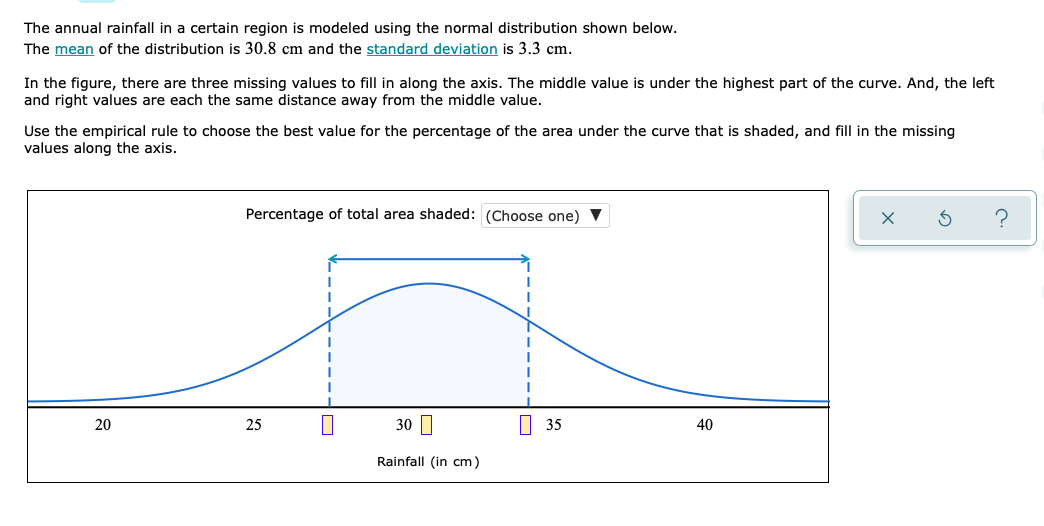
stats and prob The annual rainfall in a certain region is modeled using the normal distribution shown below. The mean of the distribution is 30.8

stats and prob

image text in transcribed
The annual rainfall in a certain region is modeled using the normal distribution shown below. The mean of the distribution is 30.8 cm and the standard deviation is 3.3 cm. In the figure, there are three missing values to fill in along the axis. The middle value is under the highest part of the curve. And, the left and right values are each the same distance away from the middle value. Use the empirical rule to choose the best value for the percentage of the area under the curve that is shaded, and fill in the missing values along the axis. Percentage of total area shaded: (Choose one) X 5 ? 20 25 30 1 35 40 Rainfall (in cm )

Step by Step Solution

There are 3 Steps involved in it

Step: 1

blur-text-image

Get Instant Access to Expert-Tailored Solutions

See step-by-step solutions with expert insights and AI powered tools for academic success

Step: 2

blur-text-image

Step: 3

blur-text-image

Ace Your Homework with AI

Get the answers you need in no time with our AI-driven, step-by-step assistance

Get Started

Recommended Textbook for

Linear Algebra With Applications

Authors: Gareth Williams, Williams

9th Edition

1284120104, 9781284120103

More Books

Students also viewed these Mathematics questions