 Step 1:
Calculate the expected return on this stock based on the CAP-M equation. SHOW YOUR WORK
To calculate the expected return, remember that the CAP-M equation is as follows:
ERstock = Rf + RPm (stock)
Where
RPm = RRmarket - Rf
Rf = The Risk Free rate. Use the current interest rate for either 10-year T-Bills.
stock = The beta of the stock. This is listed on the Nasdaq page.
RRmarket = The market return. Find out what the average return has been in an appropriate market and use the average return over the past five years for the index for that market (for example, if it is a large US stock, you could use the five-year rate for the S & P 500).
Post your answer from Step One along with the actual average return of your stock over the past five years. 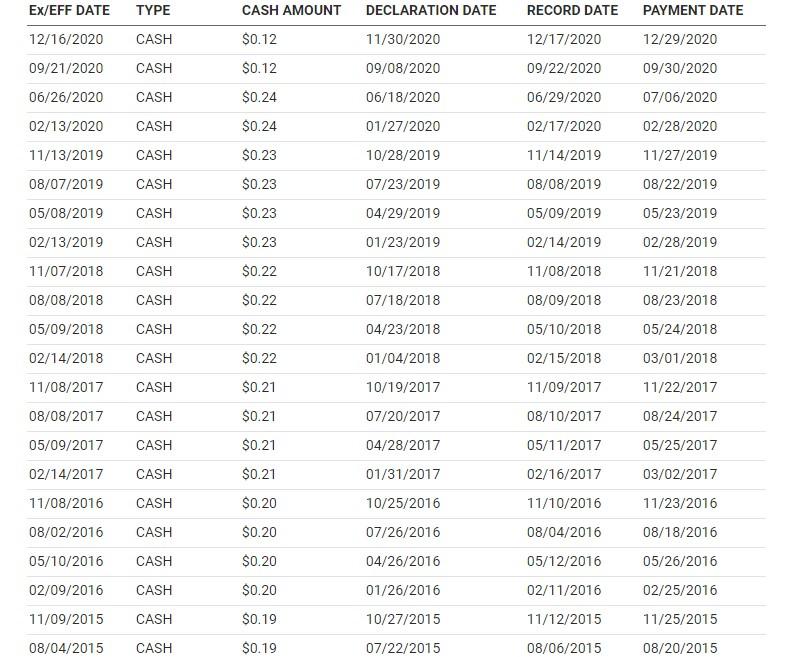
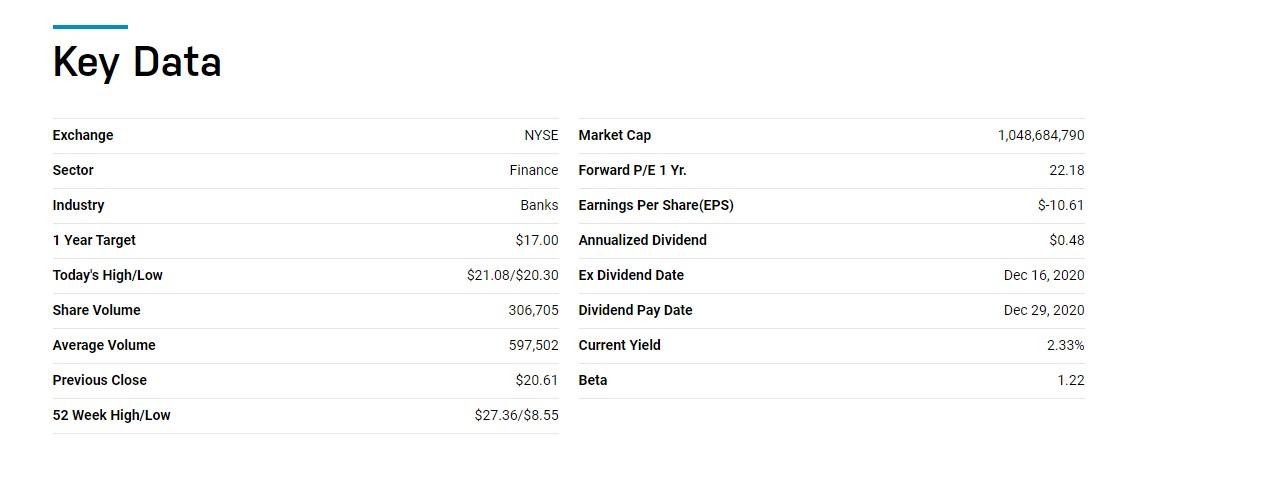
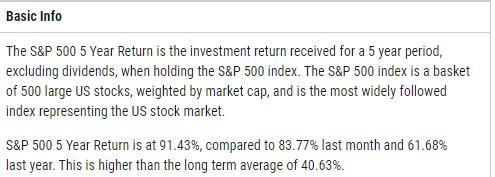
Basic Info The S&P 500 5 Year Return is the investment return received for a 5 year period, excluding dividends, when holding the S&P 500 index. The S&P 500 index is a basket of 500 large US stocks, weighted by market cap, and is the most widely followed index representing the US stock market. S&P 500 5 Year Return is at 91.43%, compared to 83.77% last month and 61.68% last year. This is higher than the long term average of 40.63%. EX/EFF DATE TYPE CASH AMOUNT DECLARATION DATE RECORD DATE 12/16/2020 CASH $0.12 11/30/2020 CASH 09/21/2020 06/26/2020 $0.12 $0.24 09/08/2020 06/18/2020 12/17/2020 09/22/2020 06/29/2020 CASH PAYMENT DATE 12/29/2020 09/30/2020 07/06/2020 02/28/2020 11/27/2019 08/22/2019 05/23/2019 02/13/2020 CASH $0.24 01/27/2020 CASH $0.23 11/13/2019 08/07/2019 02/17/2020 11/14/2019 08/08/2019 CASH $0.23 05/08/2019 CASH $0.23 10/28/2019 07/23/2019 04/29/2019 01/23/2019 10/17/2018 CASH $0.23 02/13/2019 11/07/2018 05/09/2019 02/14/2019 11/08/2018 02/28/2019 11/21/2018 CASH $0.22 08/08/2018 CASH $0.22 07/18/2018 08/09/2018 08/23/2018 CASH $0.22 05/10/2018 05/24/2018 05/09/2018 02/14/2018 11/08/2017 CASH $0.22 $0.21 04/23/2018 01/04/2018 10/19/2017 02/15/2018 11/09/2017 03/01/2018 11/22/2017 CASH 08/08/2017 CASH $0.21 07/20/2017 08/10/2017 08/24/2017 05/09/2017 CASH $0.21 04/28/2017 05/25/2017 05/11/2017 02/16/2017 02/14/2017 CASH $0.21 01/31/2017 03/02/2017 CASH $0.20 10/25/2016 11/08/2016 08/02/2016 05/10/2016 CASH $0.20 $0.20 07/26/2016 04/26/2016 11/10/2016 08/04/2016 05/12/2016 02/11/2016 11/23/2016 08/18/2016 05/26/2016 CASH 02/09/2016 CASH $0.20 01/26/2016 02/25/2016 11/09/2015 CASH $0.19 10/27/2015 11/12/2015 11/25/2015 08/04/2015 CASH $0.19 07/22/2015 08/06/2015 08/20/2015 Key Data Exchange NYSE Market Cap 1,048,684,790 Sector Finance Forward P/E 1 Yr. 22.18 Industry Banks Earnings Per Share(EPS) $-10.61 1 Year Target $17.00 Annualized Dividend $0.48 Today's High/Low $21.08/$20.30 Ex Dividend Date Dec 16, 2020 Share Volume 306,705 Dividend Pay Date Dec 29, 2020 Average Volume 597,502 Current Yield 2.33% Previous Close $20.61 Beta 1.22 52 Week High/Low $27.36/$8.55 Basic Info The S&P 500 5 Year Return is the investment return received for a 5 year period, excluding dividends, when holding the S&P 500 index. The S&P 500 index is a basket of 500 large US stocks, weighted by market cap, and is the most widely followed index representing the US stock market. S&P 500 5 Year Return is at 91.43%, compared to 83.77% last month and 61.68% last year. This is higher than the long term average of 40.63%. EX/EFF DATE TYPE CASH AMOUNT DECLARATION DATE RECORD DATE 12/16/2020 CASH $0.12 11/30/2020 CASH 09/21/2020 06/26/2020 $0.12 $0.24 09/08/2020 06/18/2020 12/17/2020 09/22/2020 06/29/2020 CASH PAYMENT DATE 12/29/2020 09/30/2020 07/06/2020 02/28/2020 11/27/2019 08/22/2019 05/23/2019 02/13/2020 CASH $0.24 01/27/2020 CASH $0.23 11/13/2019 08/07/2019 02/17/2020 11/14/2019 08/08/2019 CASH $0.23 05/08/2019 CASH $0.23 10/28/2019 07/23/2019 04/29/2019 01/23/2019 10/17/2018 CASH $0.23 02/13/2019 11/07/2018 05/09/2019 02/14/2019 11/08/2018 02/28/2019 11/21/2018 CASH $0.22 08/08/2018 CASH $0.22 07/18/2018 08/09/2018 08/23/2018 CASH $0.22 05/10/2018 05/24/2018 05/09/2018 02/14/2018 11/08/2017 CASH $0.22 $0.21 04/23/2018 01/04/2018 10/19/2017 02/15/2018 11/09/2017 03/01/2018 11/22/2017 CASH 08/08/2017 CASH $0.21 07/20/2017 08/10/2017 08/24/2017 05/09/2017 CASH $0.21 04/28/2017 05/25/2017 05/11/2017 02/16/2017 02/14/2017 CASH $0.21 01/31/2017 03/02/2017 CASH $0.20 10/25/2016 11/08/2016 08/02/2016 05/10/2016 CASH $0.20 $0.20 07/26/2016 04/26/2016 11/10/2016 08/04/2016 05/12/2016 02/11/2016 11/23/2016 08/18/2016 05/26/2016 CASH 02/09/2016 CASH $0.20 01/26/2016 02/25/2016 11/09/2015 CASH $0.19 10/27/2015 11/12/2015 11/25/2015 08/04/2015 CASH $0.19 07/22/2015 08/06/2015 08/20/2015 Key Data Exchange NYSE Market Cap 1,048,684,790 Sector Finance Forward P/E 1 Yr. 22.18 Industry Banks Earnings Per Share(EPS) $-10.61 1 Year Target $17.00 Annualized Dividend $0.48 Today's High/Low $21.08/$20.30 Ex Dividend Date Dec 16, 2020 Share Volume 306,705 Dividend Pay Date Dec 29, 2020 Average Volume 597,502 Current Yield 2.33% Previous Close $20.61 Beta 1.22 52 Week High/Low $27.36/$8.55