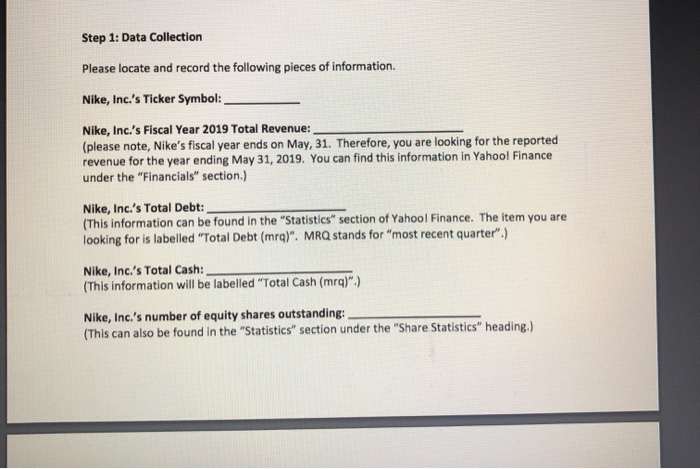
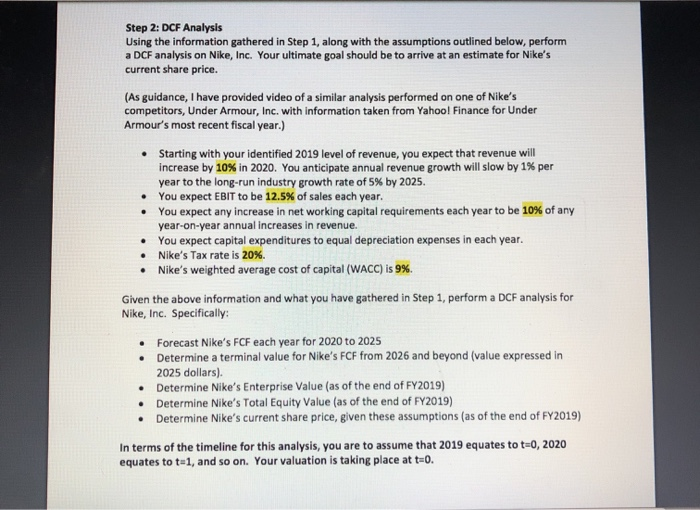
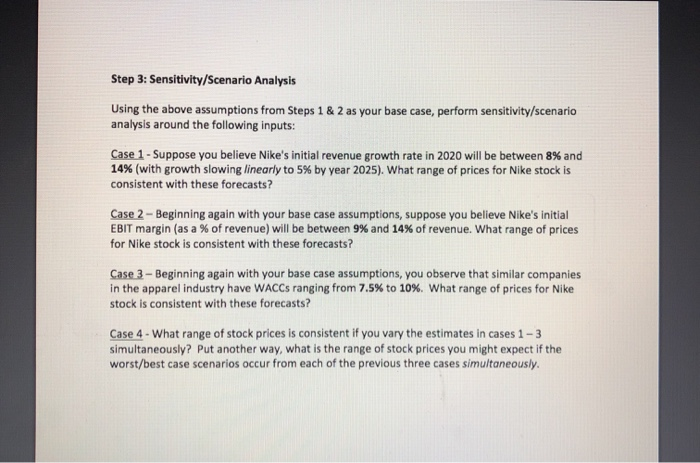
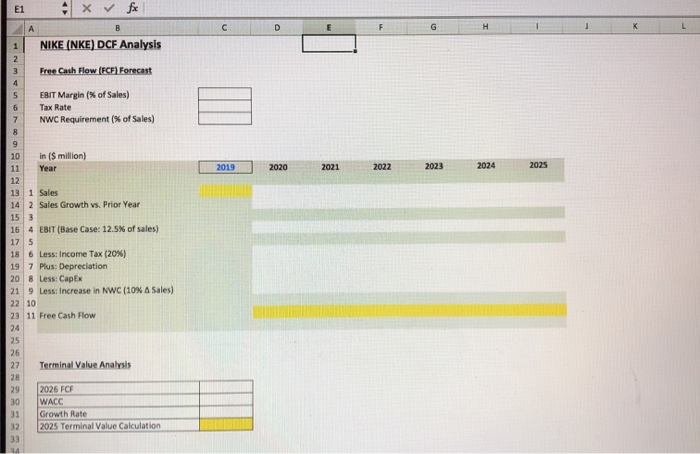
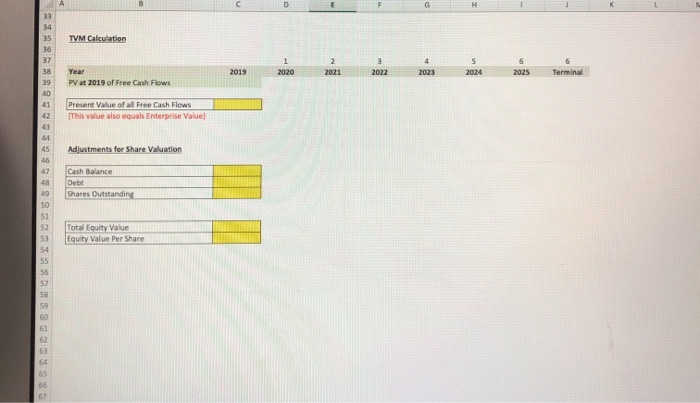
Step 1: Data Collection Please locate and record the following pieces of information. Nike, Inc.'s Ticker Symbol: Nike, Inc.'s Fiscal Year 2019 Total Revenue: _ (please note, Nike's fiscal year ends on May, 31. Therefore, you are looking for the reported revenue for the year ending May 31, 2019. You can find this information in Yahool Finance under the "Financials" section.) Nike, Inc.'s Total Debt: (This information can be found in the "Statistics" section of Yahool Finance. The item you are looking for is labelled "Total Debt (mra)". MRQ stands for "most recent quarter".) Nike, Inc.'s Total Cash: (This information will be labelled "Total Cash (mra)".) Nike, Inc.'s number of equity shares outstanding: (This can also be found in the "Statistics" section under the "Share Statistics" heading.) Step 2: DCF Analysis Using the information gathered in Step 1, along with the assumptions outlined below, perform a DCF analysis on Nike, Inc. Your ultimate goal should be to arrive at an estimate for Nike's current share price. (As guidance, I have provided video of a similar analysis performed on one of Nike's competitors, Under Armour, Inc. with information taken from Yahool Finance for Under Armour's most recent fiscal year.) Starting with your identified 2019 level of revenue, you expect that revenue will increase by 10% in 2020. You anticipate annual revenue growth will slow by 1% per year to the long-run industry growth rate of 5% by 2025. You expect EBIT to be 12.5% of sales each year. You expect any increase in net working capital requirements each year to be 10% of any year-on-year annual increases in revenue. You expect capital expenditures to equal depreciation expenses in each year. Nike's Tax rate is 20%. Nike's weighted average cost of capital (WACC) is 9% Given the above information and what you have gathered in Step 1, perform a DCF analysis for Nike, Inc. Specifically: Forecast Nike's FCF each year for 2020 to 2025 Determine a terminal value for Nike's FCF from 2026 and beyond (value expressed in 2025 dollars). Determine Nike's Enterprise Value (as of the end of FY2019) Determine Nike's Total Equity Value (as of the end of FY2019) Determine Nike's current share price, given these assumptions (as of the end of FY2019) In terms of the timeline for this analysis, you are to assume that 2019 equates to t0, 2020 equates to t=1, and so on. Your valuation is taking place at t=0. Step 3: Sensitivity/Scenario Analysis Using the above assumptions from Steps 1 & 2 as your base case, perform sensitivity/scenario analysis around the following inputs: Case 1 - Suppose you believe Nike's initial revenue growth rate in 2020 will be between 8% and 14% (with growth slowing linearly to 5% by year 2025). What range of prices for Nike stock is consistent with these forecasts? Case 2 - Beginning again with your base case assumptions, suppose you believe Nike's initial EBIT margin (as a % of revenue) will be between 9% and 14% of revenue. What range of prices for Nike stock is consistent with these forecasts? Case 3 - Beginning again with your base case assumptions, you observe that similar companies in the apparel industry have WACCs ranging from 7.5% to 10%. What range of prices for Nike stock is consistent with these forecasts? Case 4 - What range of stock prices is consistent if you vary the estimates in cases 1 - 3 simultaneously? Put another way, what is the range of stock prices you might expect if the worst/best case scenarios occur from each of the previous three cases simultaneously E1 x fc C D E G NIKE (NKE) DCF Analysis Free Cash Flow (FCF) Forecast EBIT Margin of Sales) Tax Rate NWC Requirements of Sales) in I$ million) Year 2019 2020 2021 2022 2023 2024 2025 13 1 Sales 14 2 Sales Growth vs. Prior Year 153 16 4 EBIT (Base Case: 12.5% of sales) 17 S 18 6 Less: Income Tax (20%) 19 7 Plus: Depreciation 20 8 Less: Capex 21 9 Less: Increase in NWC (10% A Sales) 22 10 23 11 Free Cash Flow Terminal Valve Analysis 2026 FCF WACC Growth Rate 2025 Terminal Value Calculation TVM Calculation PV at 2019 of Free Cash Flows Present Value of all Free Cash Flows This value also equals Enterprise Value) Adjustments for Share Valuation Shares Outstanding Total Equity Value Equity Value Per Share Step 1: Data Collection Please locate and record the following pieces of information. Nike, Inc.'s Ticker Symbol: Nike, Inc.'s Fiscal Year 2019 Total Revenue: _ (please note, Nike's fiscal year ends on May, 31. Therefore, you are looking for the reported revenue for the year ending May 31, 2019. You can find this information in Yahool Finance under the "Financials" section.) Nike, Inc.'s Total Debt: (This information can be found in the "Statistics" section of Yahool Finance. The item you are looking for is labelled "Total Debt (mra)". MRQ stands for "most recent quarter".) Nike, Inc.'s Total Cash: (This information will be labelled "Total Cash (mra)".) Nike, Inc.'s number of equity shares outstanding: (This can also be found in the "Statistics" section under the "Share Statistics" heading.) Step 2: DCF Analysis Using the information gathered in Step 1, along with the assumptions outlined below, perform a DCF analysis on Nike, Inc. Your ultimate goal should be to arrive at an estimate for Nike's current share price. (As guidance, I have provided video of a similar analysis performed on one of Nike's competitors, Under Armour, Inc. with information taken from Yahool Finance for Under Armour's most recent fiscal year.) Starting with your identified 2019 level of revenue, you expect that revenue will increase by 10% in 2020. You anticipate annual revenue growth will slow by 1% per year to the long-run industry growth rate of 5% by 2025. You expect EBIT to be 12.5% of sales each year. You expect any increase in net working capital requirements each year to be 10% of any year-on-year annual increases in revenue. You expect capital expenditures to equal depreciation expenses in each year. Nike's Tax rate is 20%. Nike's weighted average cost of capital (WACC) is 9% Given the above information and what you have gathered in Step 1, perform a DCF analysis for Nike, Inc. Specifically: Forecast Nike's FCF each year for 2020 to 2025 Determine a terminal value for Nike's FCF from 2026 and beyond (value expressed in 2025 dollars). Determine Nike's Enterprise Value (as of the end of FY2019) Determine Nike's Total Equity Value (as of the end of FY2019) Determine Nike's current share price, given these assumptions (as of the end of FY2019) In terms of the timeline for this analysis, you are to assume that 2019 equates to t0, 2020 equates to t=1, and so on. Your valuation is taking place at t=0. Step 3: Sensitivity/Scenario Analysis Using the above assumptions from Steps 1 & 2 as your base case, perform sensitivity/scenario analysis around the following inputs: Case 1 - Suppose you believe Nike's initial revenue growth rate in 2020 will be between 8% and 14% (with growth slowing linearly to 5% by year 2025). What range of prices for Nike stock is consistent with these forecasts? Case 2 - Beginning again with your base case assumptions, suppose you believe Nike's initial EBIT margin (as a % of revenue) will be between 9% and 14% of revenue. What range of prices for Nike stock is consistent with these forecasts? Case 3 - Beginning again with your base case assumptions, you observe that similar companies in the apparel industry have WACCs ranging from 7.5% to 10%. What range of prices for Nike stock is consistent with these forecasts? Case 4 - What range of stock prices is consistent if you vary the estimates in cases 1 - 3 simultaneously? Put another way, what is the range of stock prices you might expect if the worst/best case scenarios occur from each of the previous three cases simultaneously E1 x fc C D E G NIKE (NKE) DCF Analysis Free Cash Flow (FCF) Forecast EBIT Margin of Sales) Tax Rate NWC Requirements of Sales) in I$ million) Year 2019 2020 2021 2022 2023 2024 2025 13 1 Sales 14 2 Sales Growth vs. Prior Year 153 16 4 EBIT (Base Case: 12.5% of sales) 17 S 18 6 Less: Income Tax (20%) 19 7 Plus: Depreciation 20 8 Less: Capex 21 9 Less: Increase in NWC (10% A Sales) 22 10 23 11 Free Cash Flow Terminal Valve Analysis 2026 FCF WACC Growth Rate 2025 Terminal Value Calculation TVM Calculation PV at 2019 of Free Cash Flows Present Value of all Free Cash Flows This value also equals Enterprise Value) Adjustments for Share Valuation Shares Outstanding Total Equity Value Equity Value Per Share