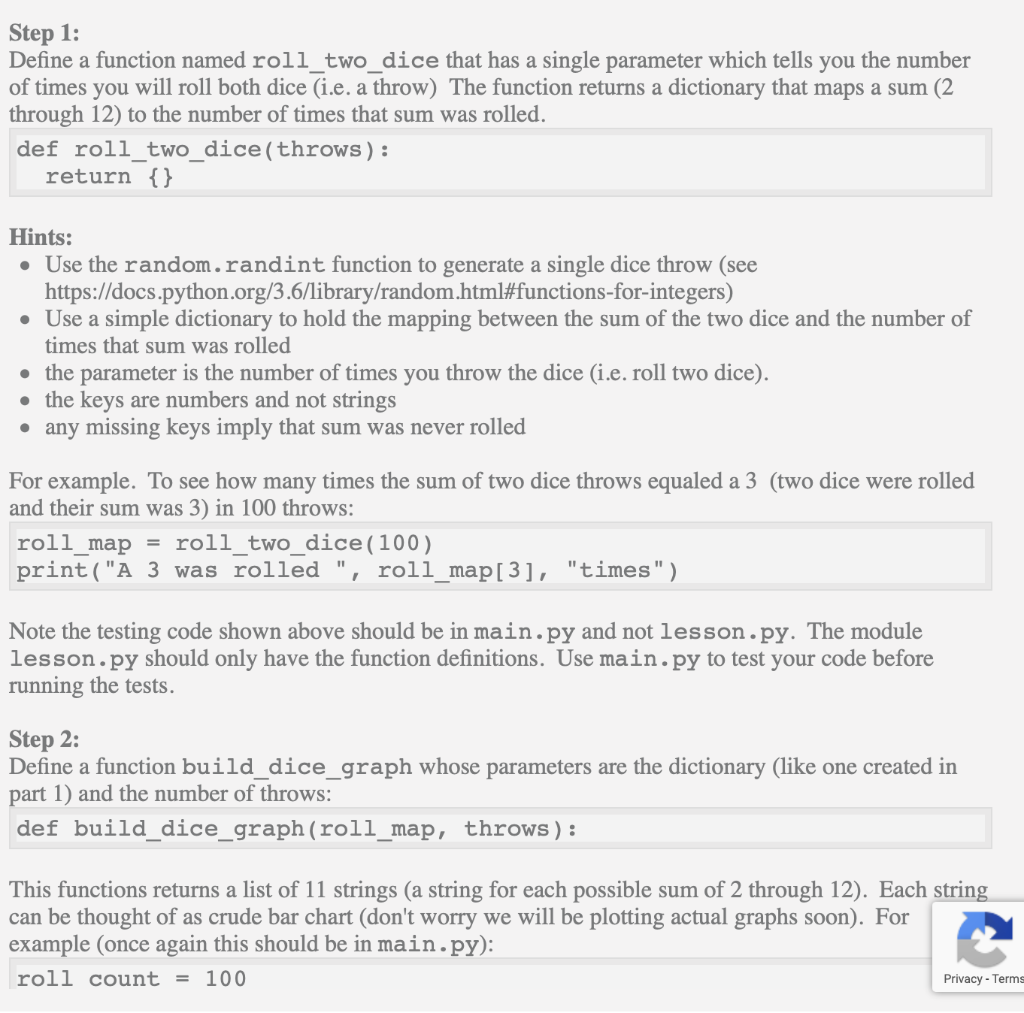

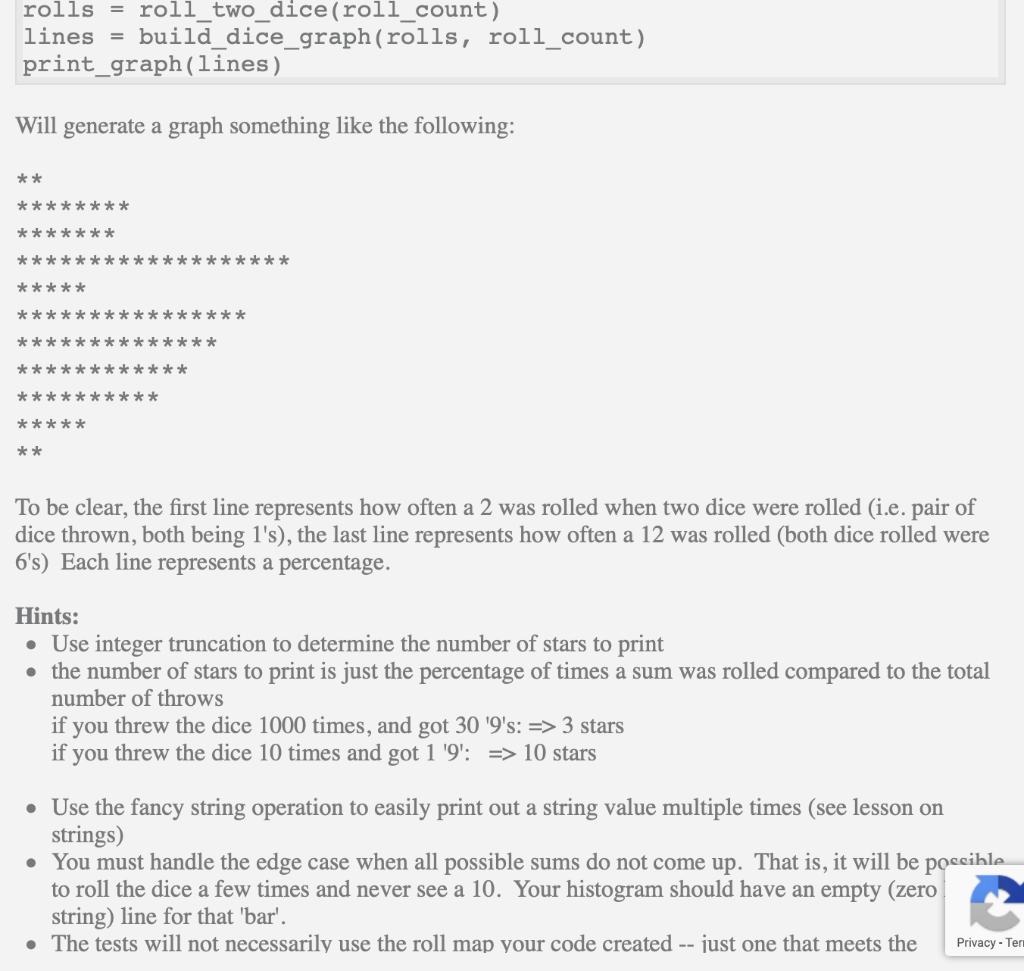
Step 1: Define a function named roll_two_dice that has a single parameter which tells you the number of times you will roll both dice (i.e. a throw) The function returns a dictionary that maps a sum (2 through 12) to the number of times that sum was rolled. def roll two_dice(throws): return {} Hints: Use the random.randint function to generate a single dice throw (see https://docs.python.org/3.6/library/random.html#functions-for-integers) Use a simple dictionary to hold the mapping between the sum of the two dice and the number of times that sum was rolled the parameter is the number of times you throw the dice (i.e. roll two dice). the keys are numbers and not strings any missing keys imply that sum was never rolled For example. To see how many times the sum of two dice throws equaled a 3 (two dice were rolled and their sum was 3) in 100 throws: roll_map = roll_two_dice(100) print("A 3 was rolled ", roll_map[3], "times") Note the testing code shown above should be in main.py and not lesson.py. The module lesson.py should only have the function definitions. Use main.py to test your code before running the tests. Step 2: Define a function build dice graph whose parameters are the dictionary (like one created in part 1) and the number of throws: def build_dice_graph (roll_map, throws) : This functions returns a list of 11 strings (a string for each possible sum of 2 through 12). Each string can be thought of as crude bar chart (don't worry we will be plotting actual graphs soon). For example (once again this should be in main.py): roll count = 100 Privacy - Terms rolls = roll_two_dice(roll_count) lines = build_dice_graph (rolls, roll_count) print_graph(lines) Will generate a graph something like the following: * * * * * ******* * * * * * * * * * * * * **************** * * * * * * * * ************* * * * * ************ ************ * * ******** * * *** * * To be clear, the first line represents how often a 2 was rolled when two dice were rolled (i.e. pair of dice thrown, both being 1's), the last line represents how often a 12 was rolled (both dice rolled were 6's) Each line represents a percentage. Hints: Use integer truncation to determine the number of stars to print the number of stars to print is just the percentage of times a sum was rolled compared to the total number of throws if you threw the dice 1000 times, and got 30 '9's: => 3 stars if you threw the dice 10 times and got 1 '9: => 10 stars Use the fancy string operation to easily print out a string value multiple times (see lesson on strings) You must handle the edge case when all possible sums do not come up. That is, it will be possible to roll the dice a few times and never see a 10. Your histogram should have an empty (zero string) line for that 'bar'. The tests will not necessarily use the roll map your code created -- just one that meets the Privacy - Teri rolls = roll_two_dice(roll_count) lines = build_dice_graph (rolls, roll_count) print_graph(lines) Will generate a graph something like the following: * * * * * ******* * * * * * * * * * * * * **************** * * * * * * * * ************* * * * * ************ ************ * * ******** * * *** * * To be clear, the first line represents how often a 2 was rolled when two dice were rolled (i.e. pair of dice thrown, both being 1's), the last line represents how often a 12 was rolled (both dice rolled were 6's) Each line represents a percentage. Hints: Use integer truncation to determine the number of stars to print the number of stars to print is just the percentage of times a sum was rolled compared to the total number of throws if you threw the dice 1000 times, and got 30 '9's: => 3 stars if you threw the dice 10 times and got 1 '9: => 10 stars Use the fancy string operation to easily print out a string value multiple times (see lesson on strings) You must handle the edge case when all possible sums do not come up. That is, it will be possible to roll the dice a few times and never see a 10. Your histogram should have an empty (zero string) line for that 'bar'. The tests will not necessarily use the roll map your code created -- just one that meets the Privacy - Teri