

Answered step by step
Verified Expert Solution
Question
1 Approved Answer
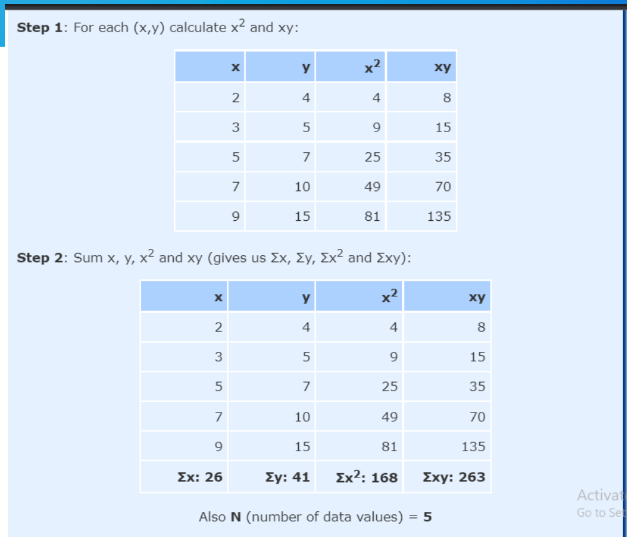
Step 1: Fur each [1,?) calculate :2 and my: 4 B 2 4 3 5 9 15 5 ? 25 35 ? 10 49 ?D


Step by Step Solution
There are 3 Steps involved in it
Step: 1

Get Instant Access to Expert-Tailored Solutions
See step-by-step solutions with expert insights and AI powered tools for academic success
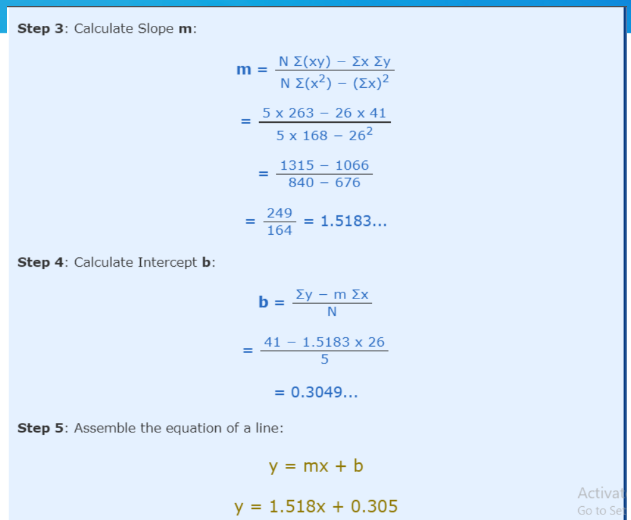
Step: 2

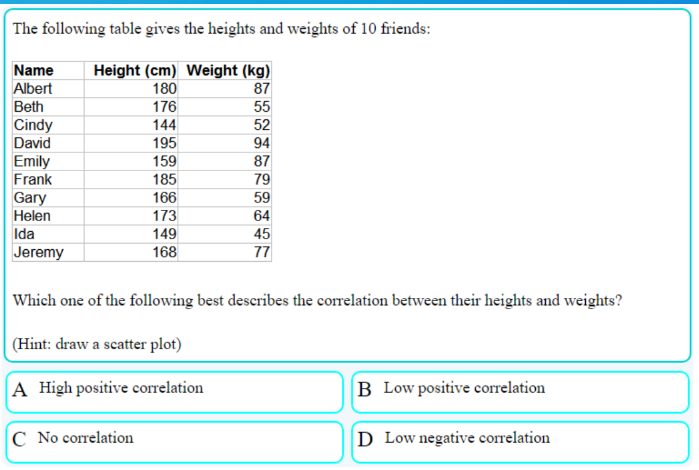
Step: 3
Ace Your Homework with AI
Get the answers you need in no time with our AI-driven, step-by-step assistance
Get Started
Structural Analysis
Authors: Russell C. Hibbeler
8th Edition
132570534, 013257053X, 978-0132570534