Question
Step 1: Performance Overview Based on Annual Quantitative Information Use sources such as Mergent Online Database (available through college library) and Yahoo! Finance to create
Step 1: Performance Overview Based on Annual Quantitative Information
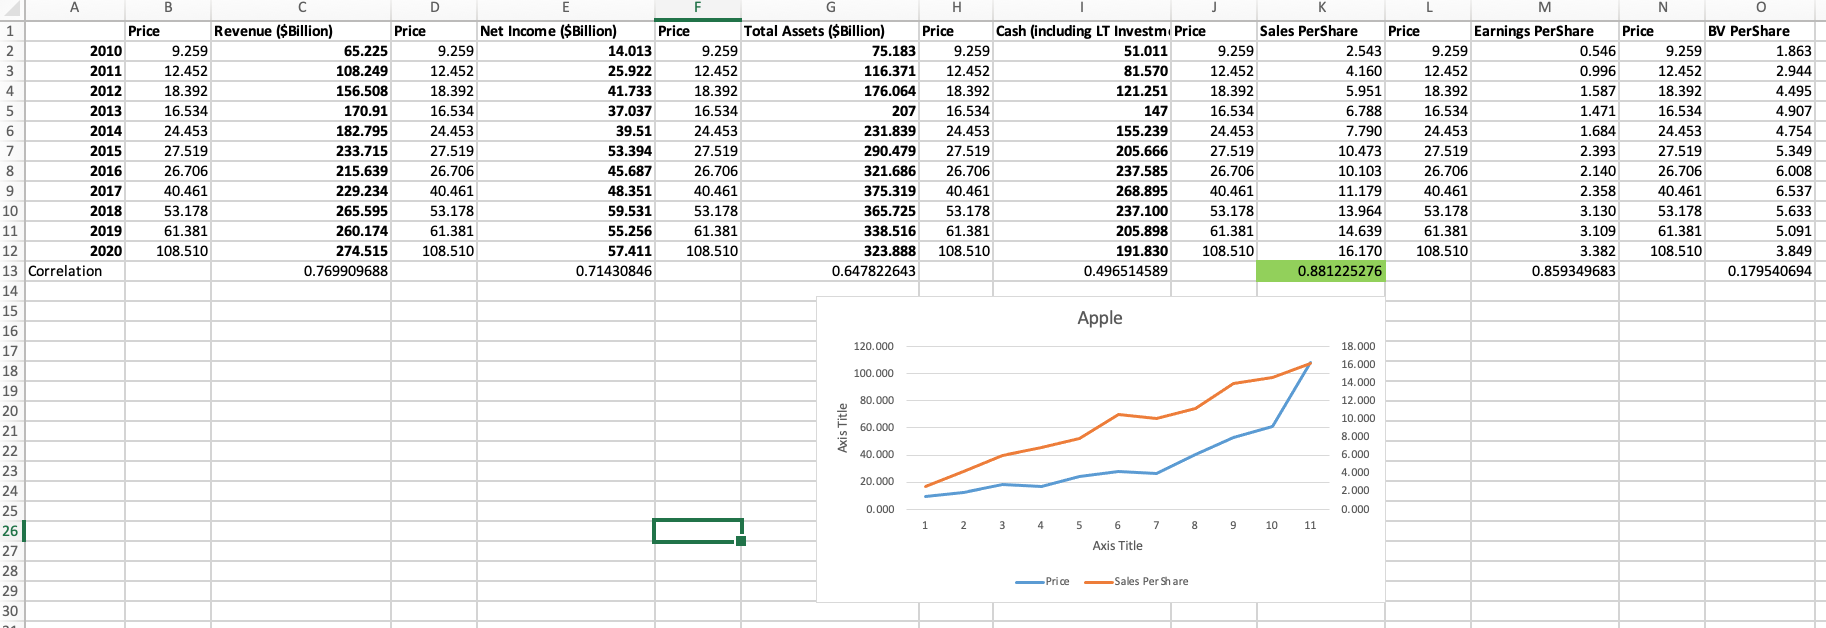
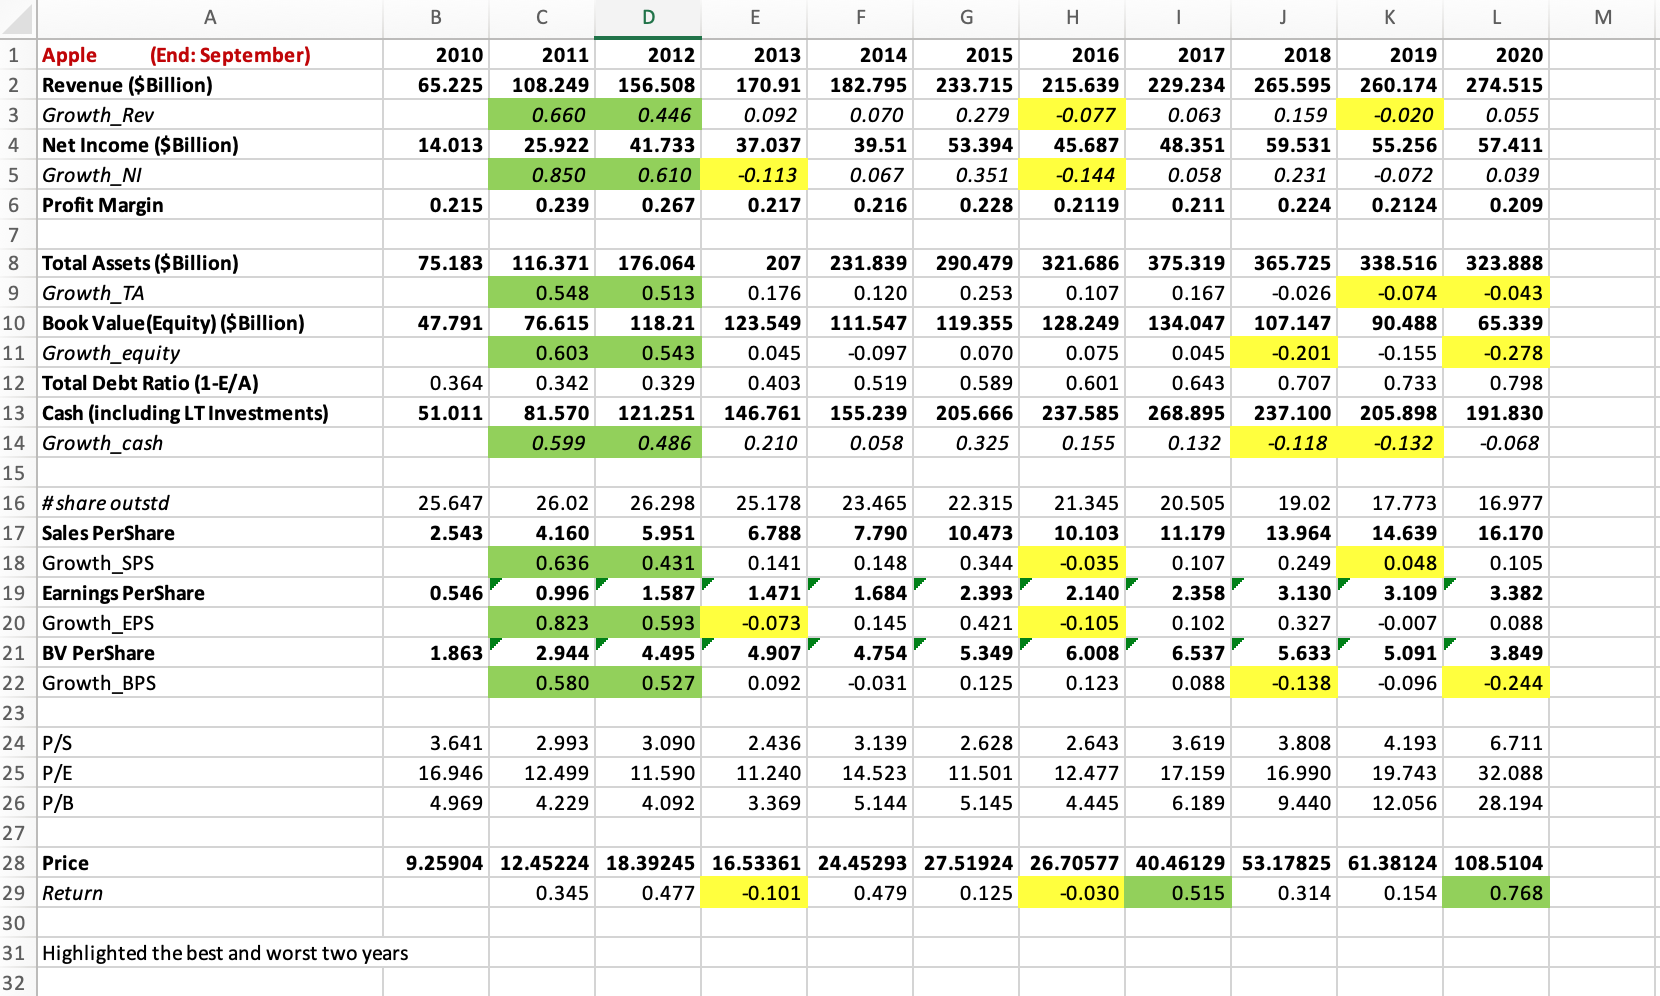
Use sources such as Mergent Online Database (available through college library) and Yahoo! Finance to create an Excel file to provide an overview of the companys performance. A module using Apple as an example is available in the Stock Tracking Project folder on the Spring. There should be two excel sheets in the file. The first one, the yearly data sheet, is to demonstrate the fundamental financial information of the company. Please highlight the best and worst two years of the companys pe rformance based on the financial items as shown in the module. In the second sheet, the correlation sheet, please calculate the correlations between the companys yearly stock prices and some selected financial items. Please generate a chart for the series with the highest correlation for Adobe Inc.
B D E F G H 1 J L M . 1 Apple (End: September) 2010 2011 2012 2013 2014 2015 2016 2017 2018 2019 2020 2 Revenue ($Billion) 65.225 108.249 156.508 170.91 182.795 233.715 215.639 229.234 265.595 260.174 274.515 3 Growth_Rev 0.660 0.446 0.092 0.070 0.279 -0.077 0.063 0.159 -0.020 0.055 4 Net Income ($Billion) 14.013 25.922 41.733 37.037 39.51 53.394 45.687 48.351 59.531 55.256 57.411 5 Growth_NI 0.850 0.610 -0.113 0.067 0.351 -0.144 0.058 0.231 -0.072 0.039 6 Profit Margin 0.215 0.239 0.267 0.217 0.216 0.228 0.2119 0.211 0.224 0.2124 0.209 7 8 Total Assets ($Billion) 75.183 116.371 176.064 207 231.839 290.479 321.686 375.319 365.725 338.516 323.888 9 Growth_TA 0.548 0.513 0.176 0.120 0.253 0.107 0.167 -0.026 -0.074 -0.043 10 Book Value (Equity) ($Billion) 47.791 76.615 118.21 123.549 111.547 119.355 128.249 134.047 107.147 90.488 65.339 11 Growth_equity 0.603 0.543 0.045 -0.097 0.070 0.075 0.045 -0.201 -0.155 -0.278 12 Total Debt Ratio (1-E/A) 0.364 0.342 0.329 0.403 0.519 0.589 0.601 0.643 0.707 0.733 0.798 13 Cash (including LT Investments) 51.011 81.570 121.251 146.761 155.239 205.666 237.585 268.895 237.100 205.898 191.830 14 Growth_cash 0.599 0.486 0.210 0.058 0.325 0.155 0.132 -0.118 -0.132 -0.068 15 16 #share outstd 25.647 26.02 26.298 25.178 23.465 22.315 21.345 20.505 19.02 17.773 16.977 17 Sales PerShare 2.543 4.160 5.951 6.788 7.790 10.473 10.103 11.179 13.964 14.639 16.170 18 Growth_SPS 0.636 0.431 0.141 0.148 0.344 -0.035 0.107 0.249 0.048 0.105 19 Earnings PerShare 0.546 0.996 1.587 1.471 1.684 2.393 2.140 2.358 3.130 3.109 3.382 20 Growth_EPS 0.823 0.593 -0.073 0.145 0.421 -0.105 0.102 0.327 -0.007 0.088 21 BV PerShare 1.863 2.944 4.495 4.907 4.754 5.349 6.008 6.537 5.633 5.091 3.849 22 Growth_BPS 0.580 0.527 0.092 -0.031 0.125 0.123 0.088 -0.138 -0.096 -0.244 23 24 P/S 3.641 2.993 3.090 2.436 3.139 2.628 2.643 3.619 3.808 4.193 6.711 25 P/E 16.946 12.499 11.590 11.240 14.523 11.501 12.477 17.159 16.990 19.743 32.088 26 P/B 4.969 4.229 4.092 3.369 5.144 5.145 4.445 6.189 9.440 12.056 28.194 27 28 Price 9.25904 12.45224 18.39245 16.53361 24.45293 27.51924 26.70577 40.46129 53.17825 61.38124 108.5104 29 Return 0.345 0.477 -0.101 0.479 0.125 -0.030 0.515 0.314 0.154 0.768 30 31 Highlighted the best and worst two years 32 B D E F G H 1 J L M . 1 Apple (End: September) 2010 2011 2012 2013 2014 2015 2016 2017 2018 2019 2020 2 Revenue ($Billion) 65.225 108.249 156.508 170.91 182.795 233.715 215.639 229.234 265.595 260.174 274.515 3 Growth_Rev 0.660 0.446 0.092 0.070 0.279 -0.077 0.063 0.159 -0.020 0.055 4 Net Income ($Billion) 14.013 25.922 41.733 37.037 39.51 53.394 45.687 48.351 59.531 55.256 57.411 5 Growth_NI 0.850 0.610 -0.113 0.067 0.351 -0.144 0.058 0.231 -0.072 0.039 6 Profit Margin 0.215 0.239 0.267 0.217 0.216 0.228 0.2119 0.211 0.224 0.2124 0.209 7 8 Total Assets ($Billion) 75.183 116.371 176.064 207 231.839 290.479 321.686 375.319 365.725 338.516 323.888 9 Growth_TA 0.548 0.513 0.176 0.120 0.253 0.107 0.167 -0.026 -0.074 -0.043 10 Book Value (Equity) ($Billion) 47.791 76.615 118.21 123.549 111.547 119.355 128.249 134.047 107.147 90.488 65.339 11 Growth_equity 0.603 0.543 0.045 -0.097 0.070 0.075 0.045 -0.201 -0.155 -0.278 12 Total Debt Ratio (1-E/A) 0.364 0.342 0.329 0.403 0.519 0.589 0.601 0.643 0.707 0.733 0.798 13 Cash (including LT Investments) 51.011 81.570 121.251 146.761 155.239 205.666 237.585 268.895 237.100 205.898 191.830 14 Growth_cash 0.599 0.486 0.210 0.058 0.325 0.155 0.132 -0.118 -0.132 -0.068 15 16 #share outstd 25.647 26.02 26.298 25.178 23.465 22.315 21.345 20.505 19.02 17.773 16.977 17 Sales PerShare 2.543 4.160 5.951 6.788 7.790 10.473 10.103 11.179 13.964 14.639 16.170 18 Growth_SPS 0.636 0.431 0.141 0.148 0.344 -0.035 0.107 0.249 0.048 0.105 19 Earnings PerShare 0.546 0.996 1.587 1.471 1.684 2.393 2.140 2.358 3.130 3.109 3.382 20 Growth_EPS 0.823 0.593 -0.073 0.145 0.421 -0.105 0.102 0.327 -0.007 0.088 21 BV PerShare 1.863 2.944 4.495 4.907 4.754 5.349 6.008 6.537 5.633 5.091 3.849 22 Growth_BPS 0.580 0.527 0.092 -0.031 0.125 0.123 0.088 -0.138 -0.096 -0.244 23 24 P/S 3.641 2.993 3.090 2.436 3.139 2.628 2.643 3.619 3.808 4.193 6.711 25 P/E 16.946 12.499 11.590 11.240 14.523 11.501 12.477 17.159 16.990 19.743 32.088 26 P/B 4.969 4.229 4.092 3.369 5.144 5.145 4.445 6.189 9.440 12.056 28.194 27 28 Price 9.25904 12.45224 18.39245 16.53361 24.45293 27.51924 26.70577 40.46129 53.17825 61.38124 108.5104 29 Return 0.345 0.477 -0.101 0.479 0.125 -0.030 0.515 0.314 0.154 0.768 30 31 Highlighted the best and worst two years 32
Step by Step Solution
There are 3 Steps involved in it
Step: 1

Get Instant Access to Expert-Tailored Solutions
See step-by-step solutions with expert insights and AI powered tools for academic success
Step: 2

Step: 3

Ace Your Homework with AI
Get the answers you need in no time with our AI-driven, step-by-step assistance
Get Started


