

Question
Step 2 : Now begin using the Excel spreadsheet that you downloaded for this assignment. Enter annual price and dividend data into the spreadsheet provided;
Step 2: Now begin using the Excel spreadsheet that you downloaded for this assignment.
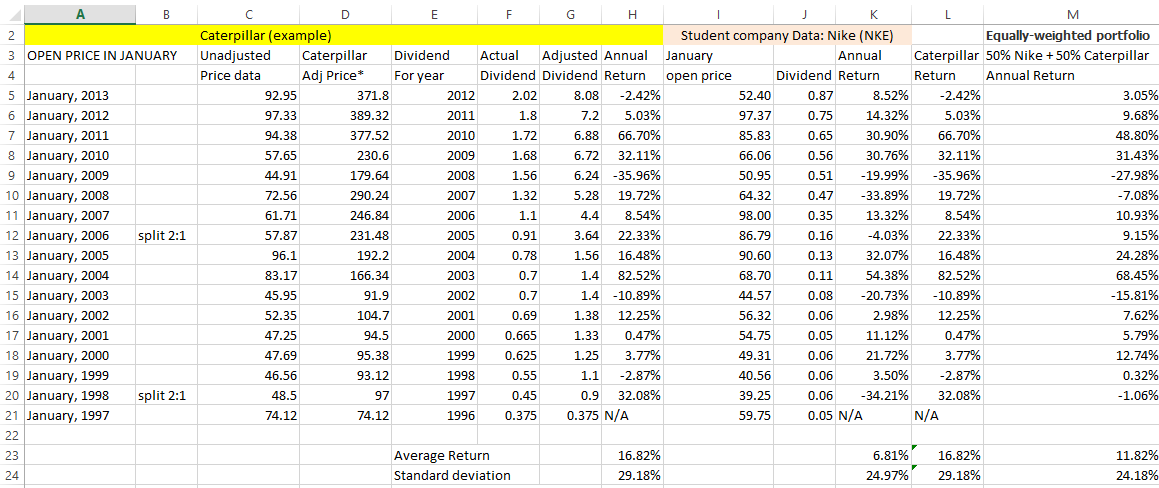
Enter annual price and dividend data into the spreadsheet provided; adjust stock prices and dividends for any stock splits that occurred during the coverage period.
Find the open price quote in the first day reported of January of 2013 and enter it into your spreadsheet.
Find the dividends that were paid last year and enter it into your spreadsheet. If your firm pays quarterly dividends (like Caterpillar), add the 4 dividends paid that year to get annual dividends.
Continue this process to 2012, 2011, and so on to complete the table for your firm. Enter all price and dividend information into the spreadsheet (in the columns that say Student Company).
There is a column for Caterpillar so you can follow the process in your entry and calculations. Note that Caterpillar had a 2:1 stock split in 1997 and 2005 and I have adjusted the price information for that split on my spreadsheet. If you have stock splits, you will have to make similar adjustments to stock price and dividends. Download your companys price information (from Yahoo) to a spreadsheet and attach it to your submission.
After you have entered all of your company data, compute the company's annual return. Then compute the company's average annual return (at the bottom of your company column) as well as the standard deviation of that return.
Now form an equally-weighted portfolio and compute the portfolio's annual return for all years (you will need to create a portfolio column if there is not one there). Then compute the average annual return as well as the standard deviation of that return.
Finally, compute the average standard deviation of the stocks in the portfolio. You should discover that this average standard deviation is significantly larger than the portfolio's standard deviation. In a sentence or two, explain why the average standard deviation is so much larger than the portfolio's standard deviation; i.e., what has caused this difference? You can put this short discussion right on your spreadsheet.
Hey, I am having issues with the very last part of the assignment (compute the average standard deviation of the stocks in the portfolio. You should discover that this average standard deviation is significantly larger than the portfolio's standard deviation). Also, based on the image, am I performing the other steps correctly, seems pretty straightforward but I wanted to be sure,Thank you!
Step by Step Solution
There are 3 Steps involved in it
Step: 1

Get Instant Access to Expert-Tailored Solutions
See step-by-step solutions with expert insights and AI powered tools for academic success
Step: 2

Step: 3
Ace Your Homework with AI
Get the answers you need in no time with our AI-driven, step-by-step assistance
Get Started
Social Finance Shadow Banking During The Global Financial Crisis
Authors: Neil Shenai
1st Edition
3030082318, 978-3030082314