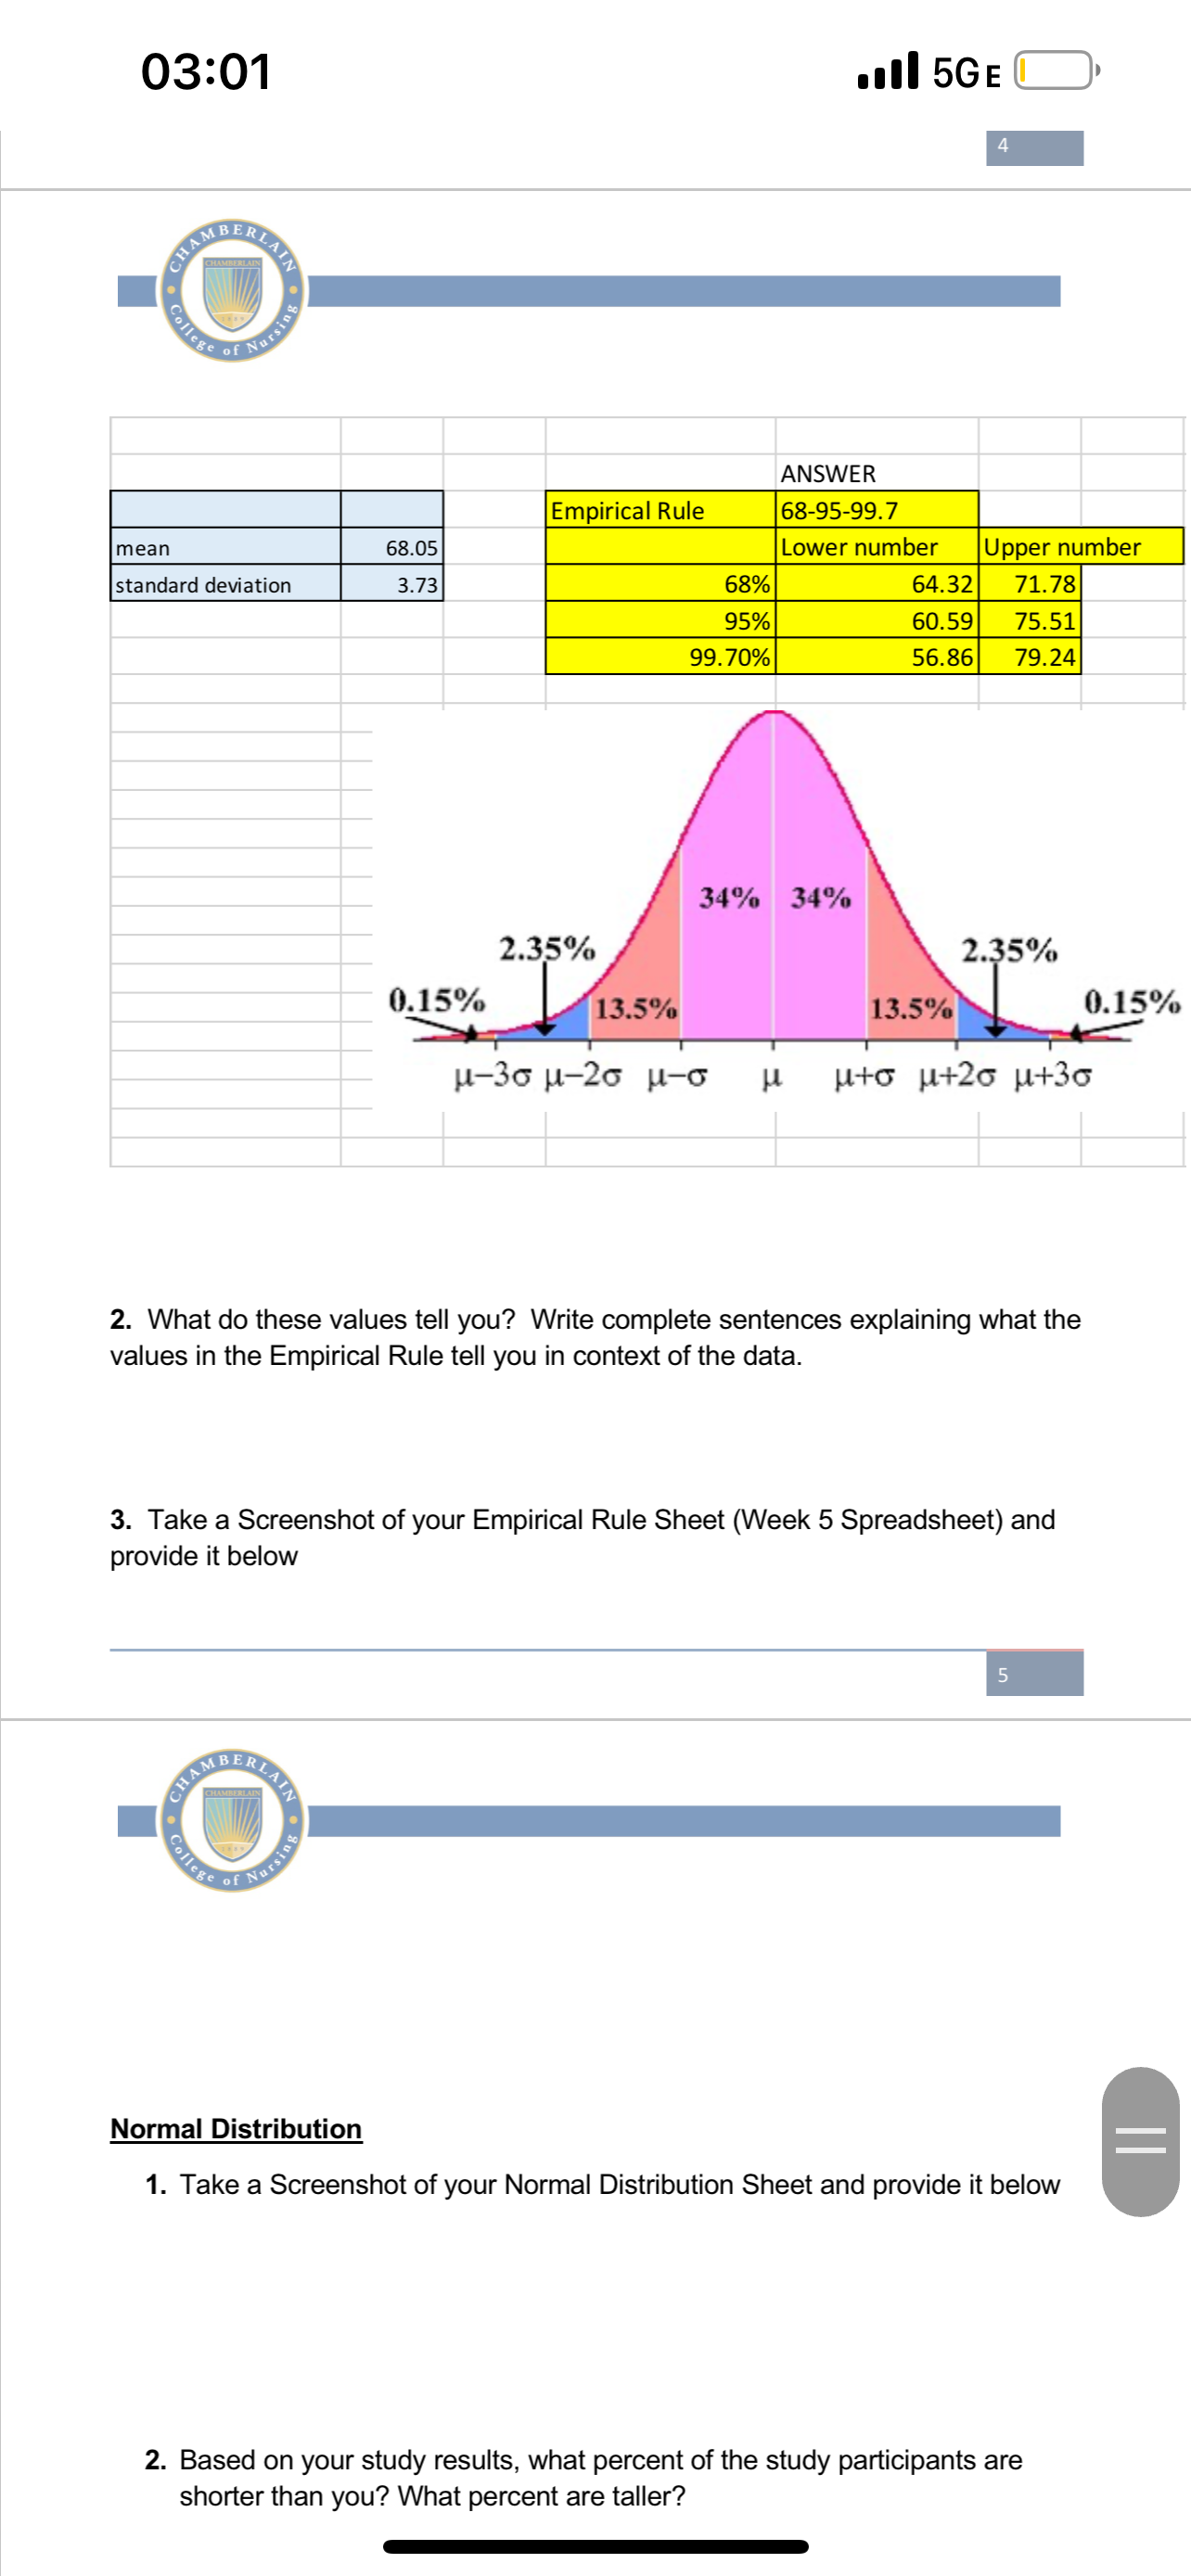
Step 3. Data Analysis Answer the following questions. Use the Week 5 Excel spreadsheets to help analyze the data. Empirical Rule 1. Determine the 68%,
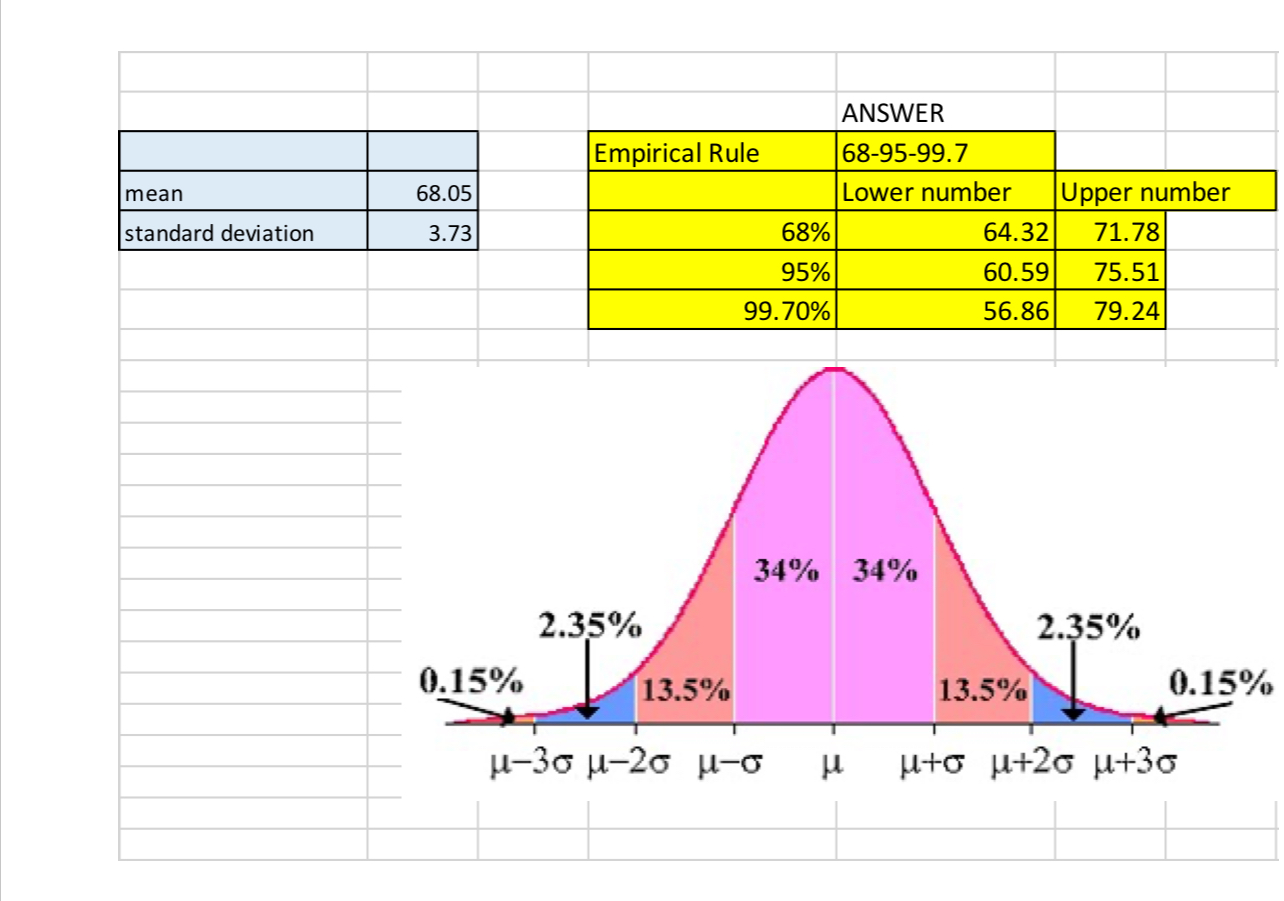
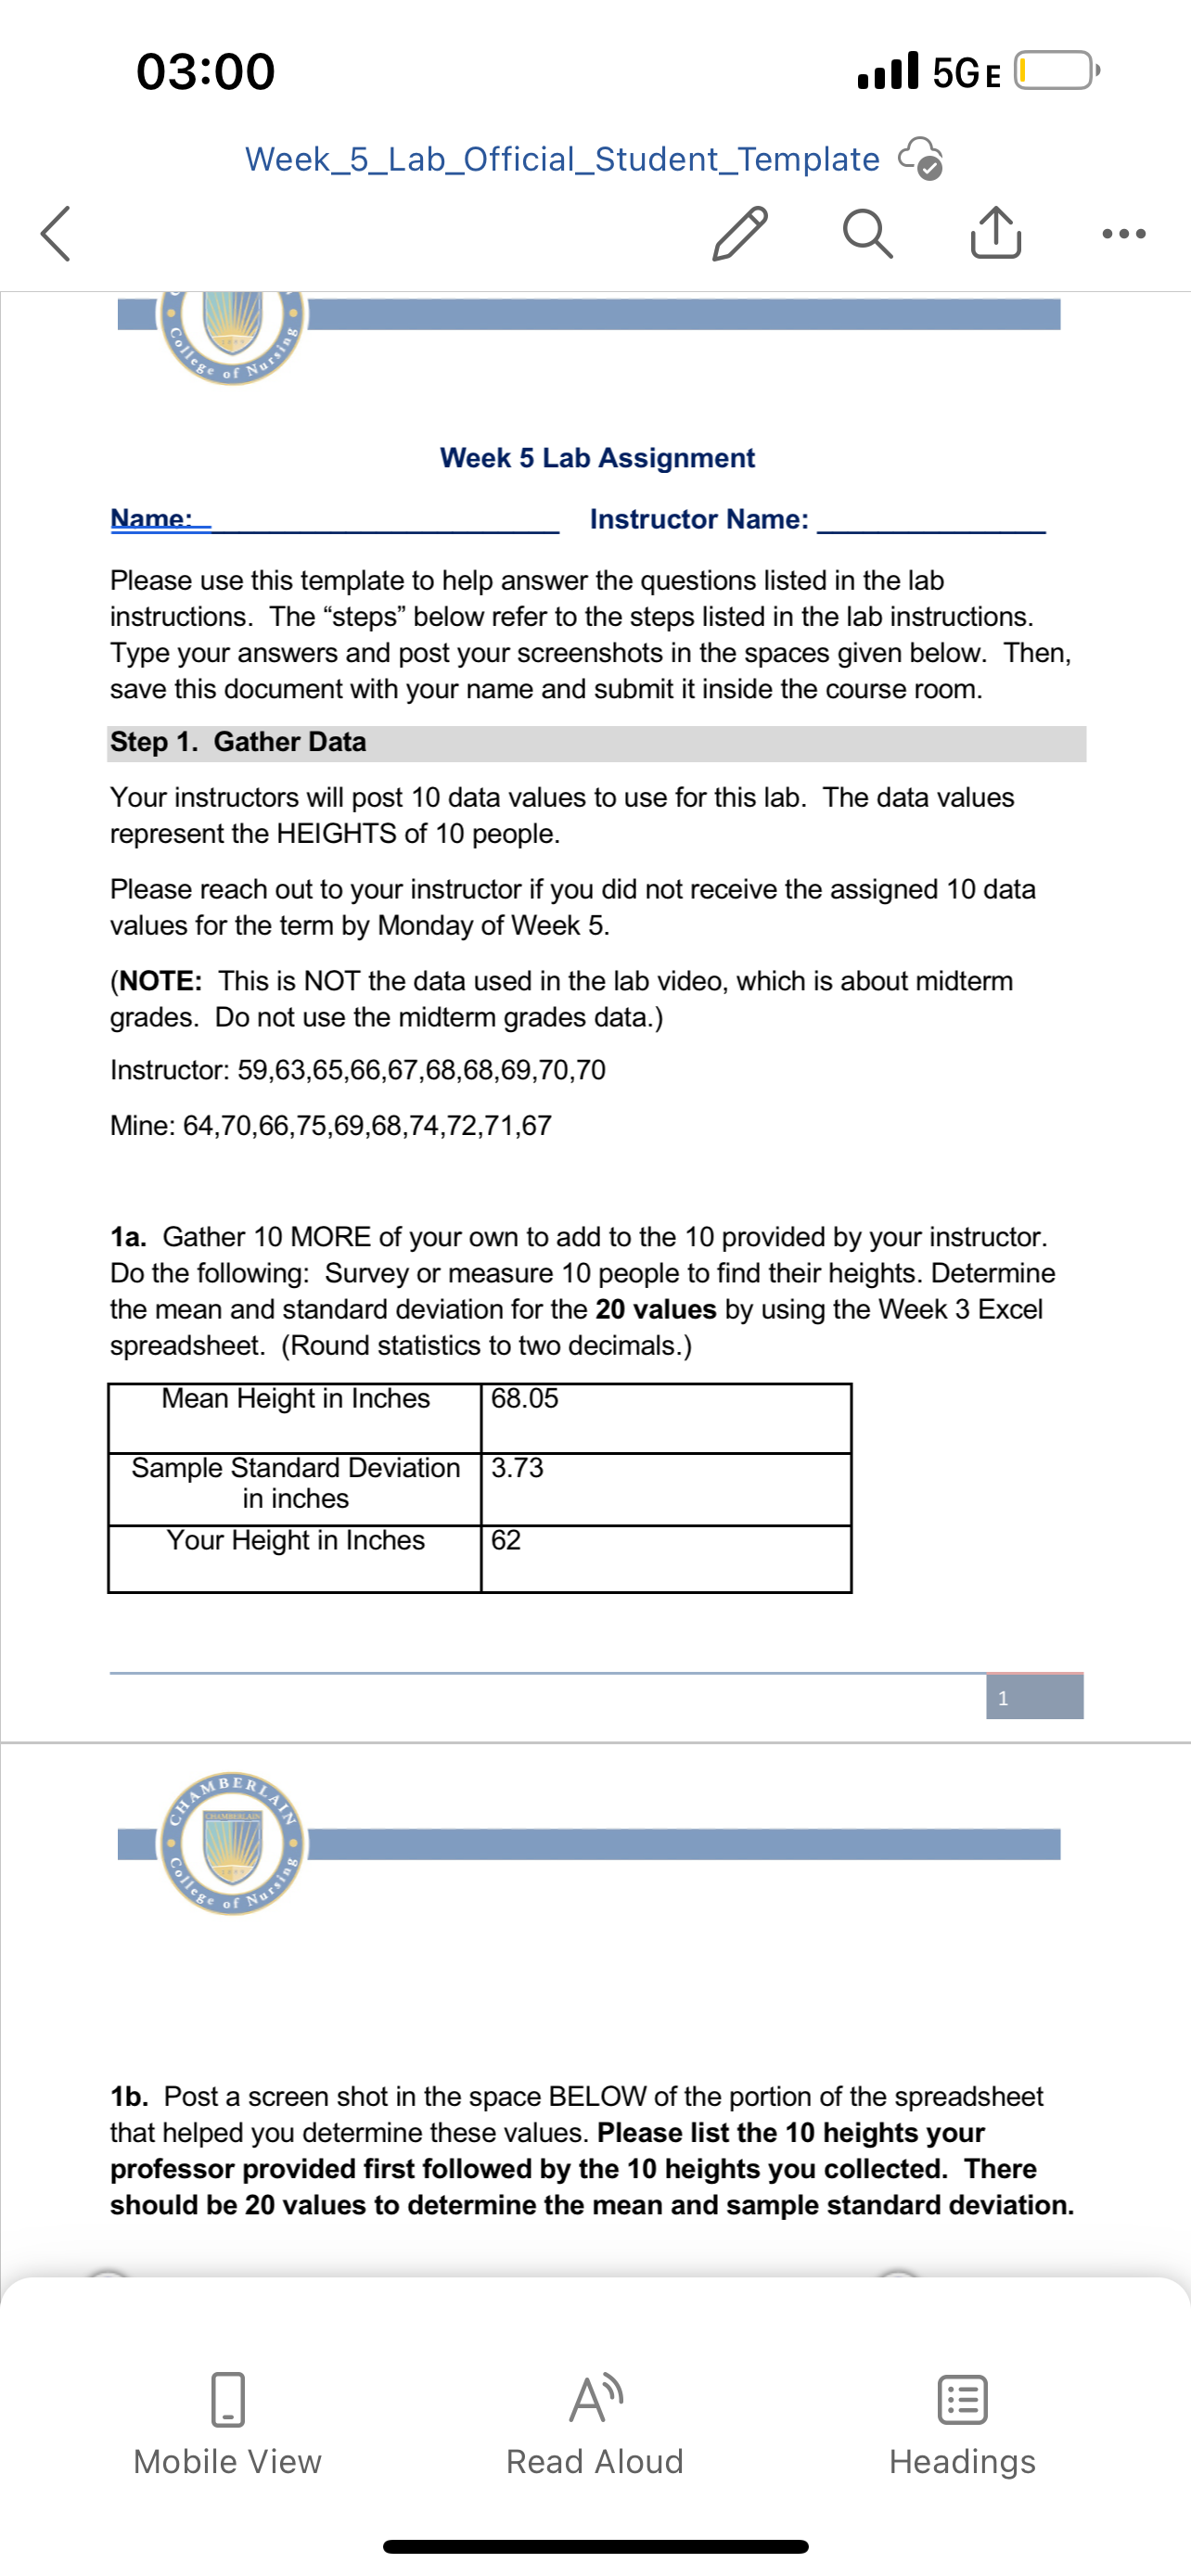
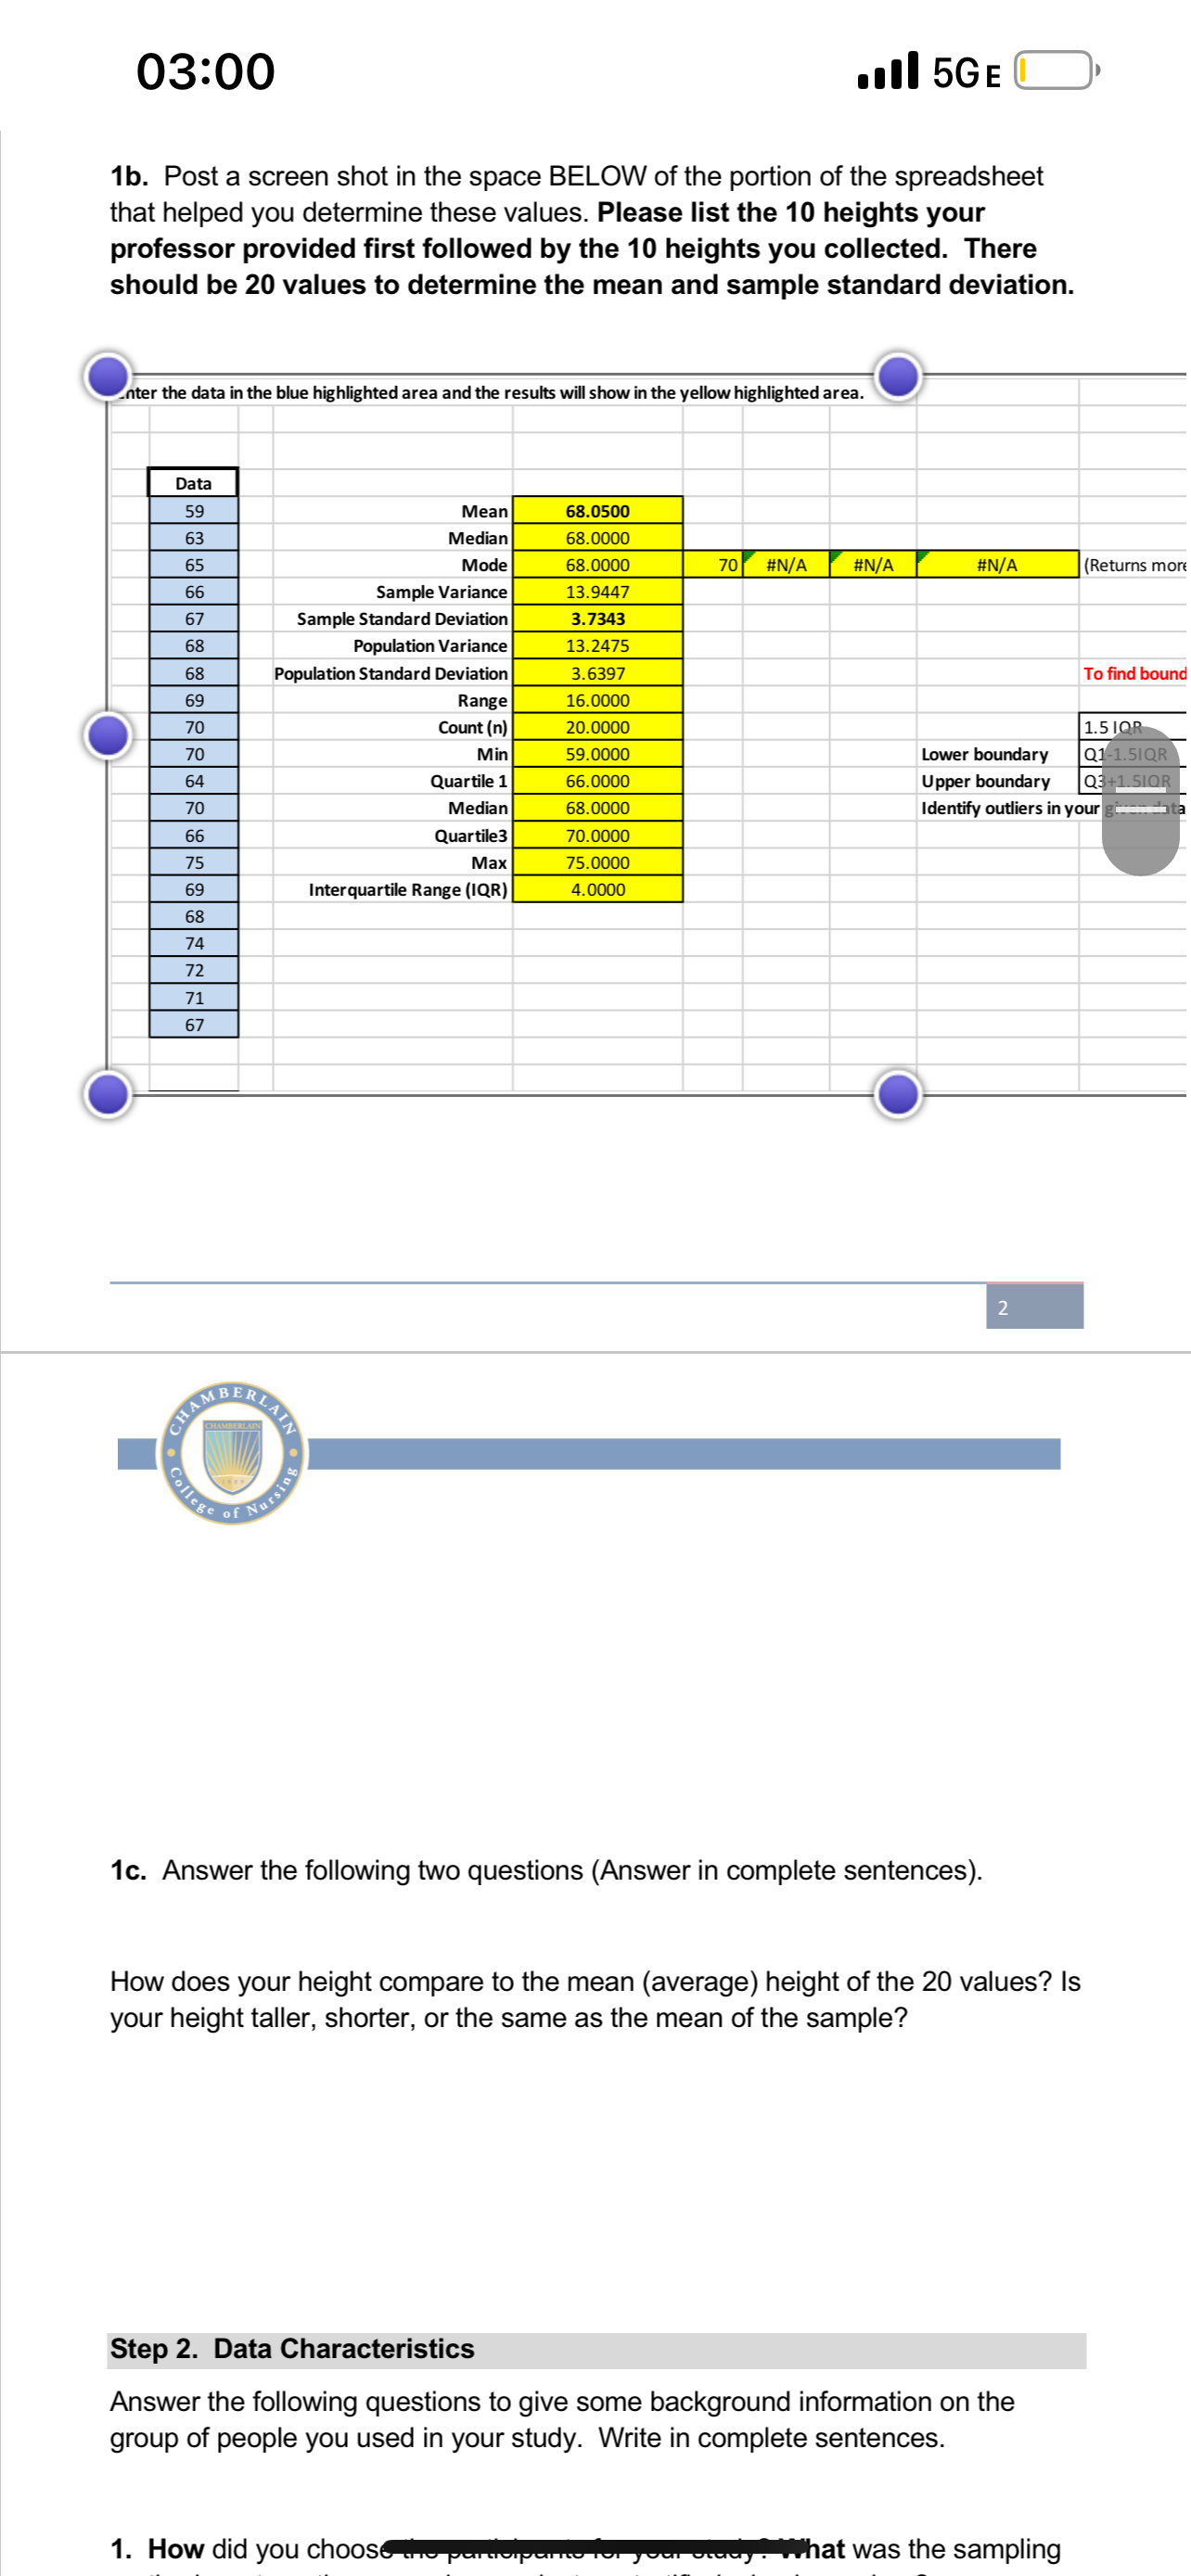
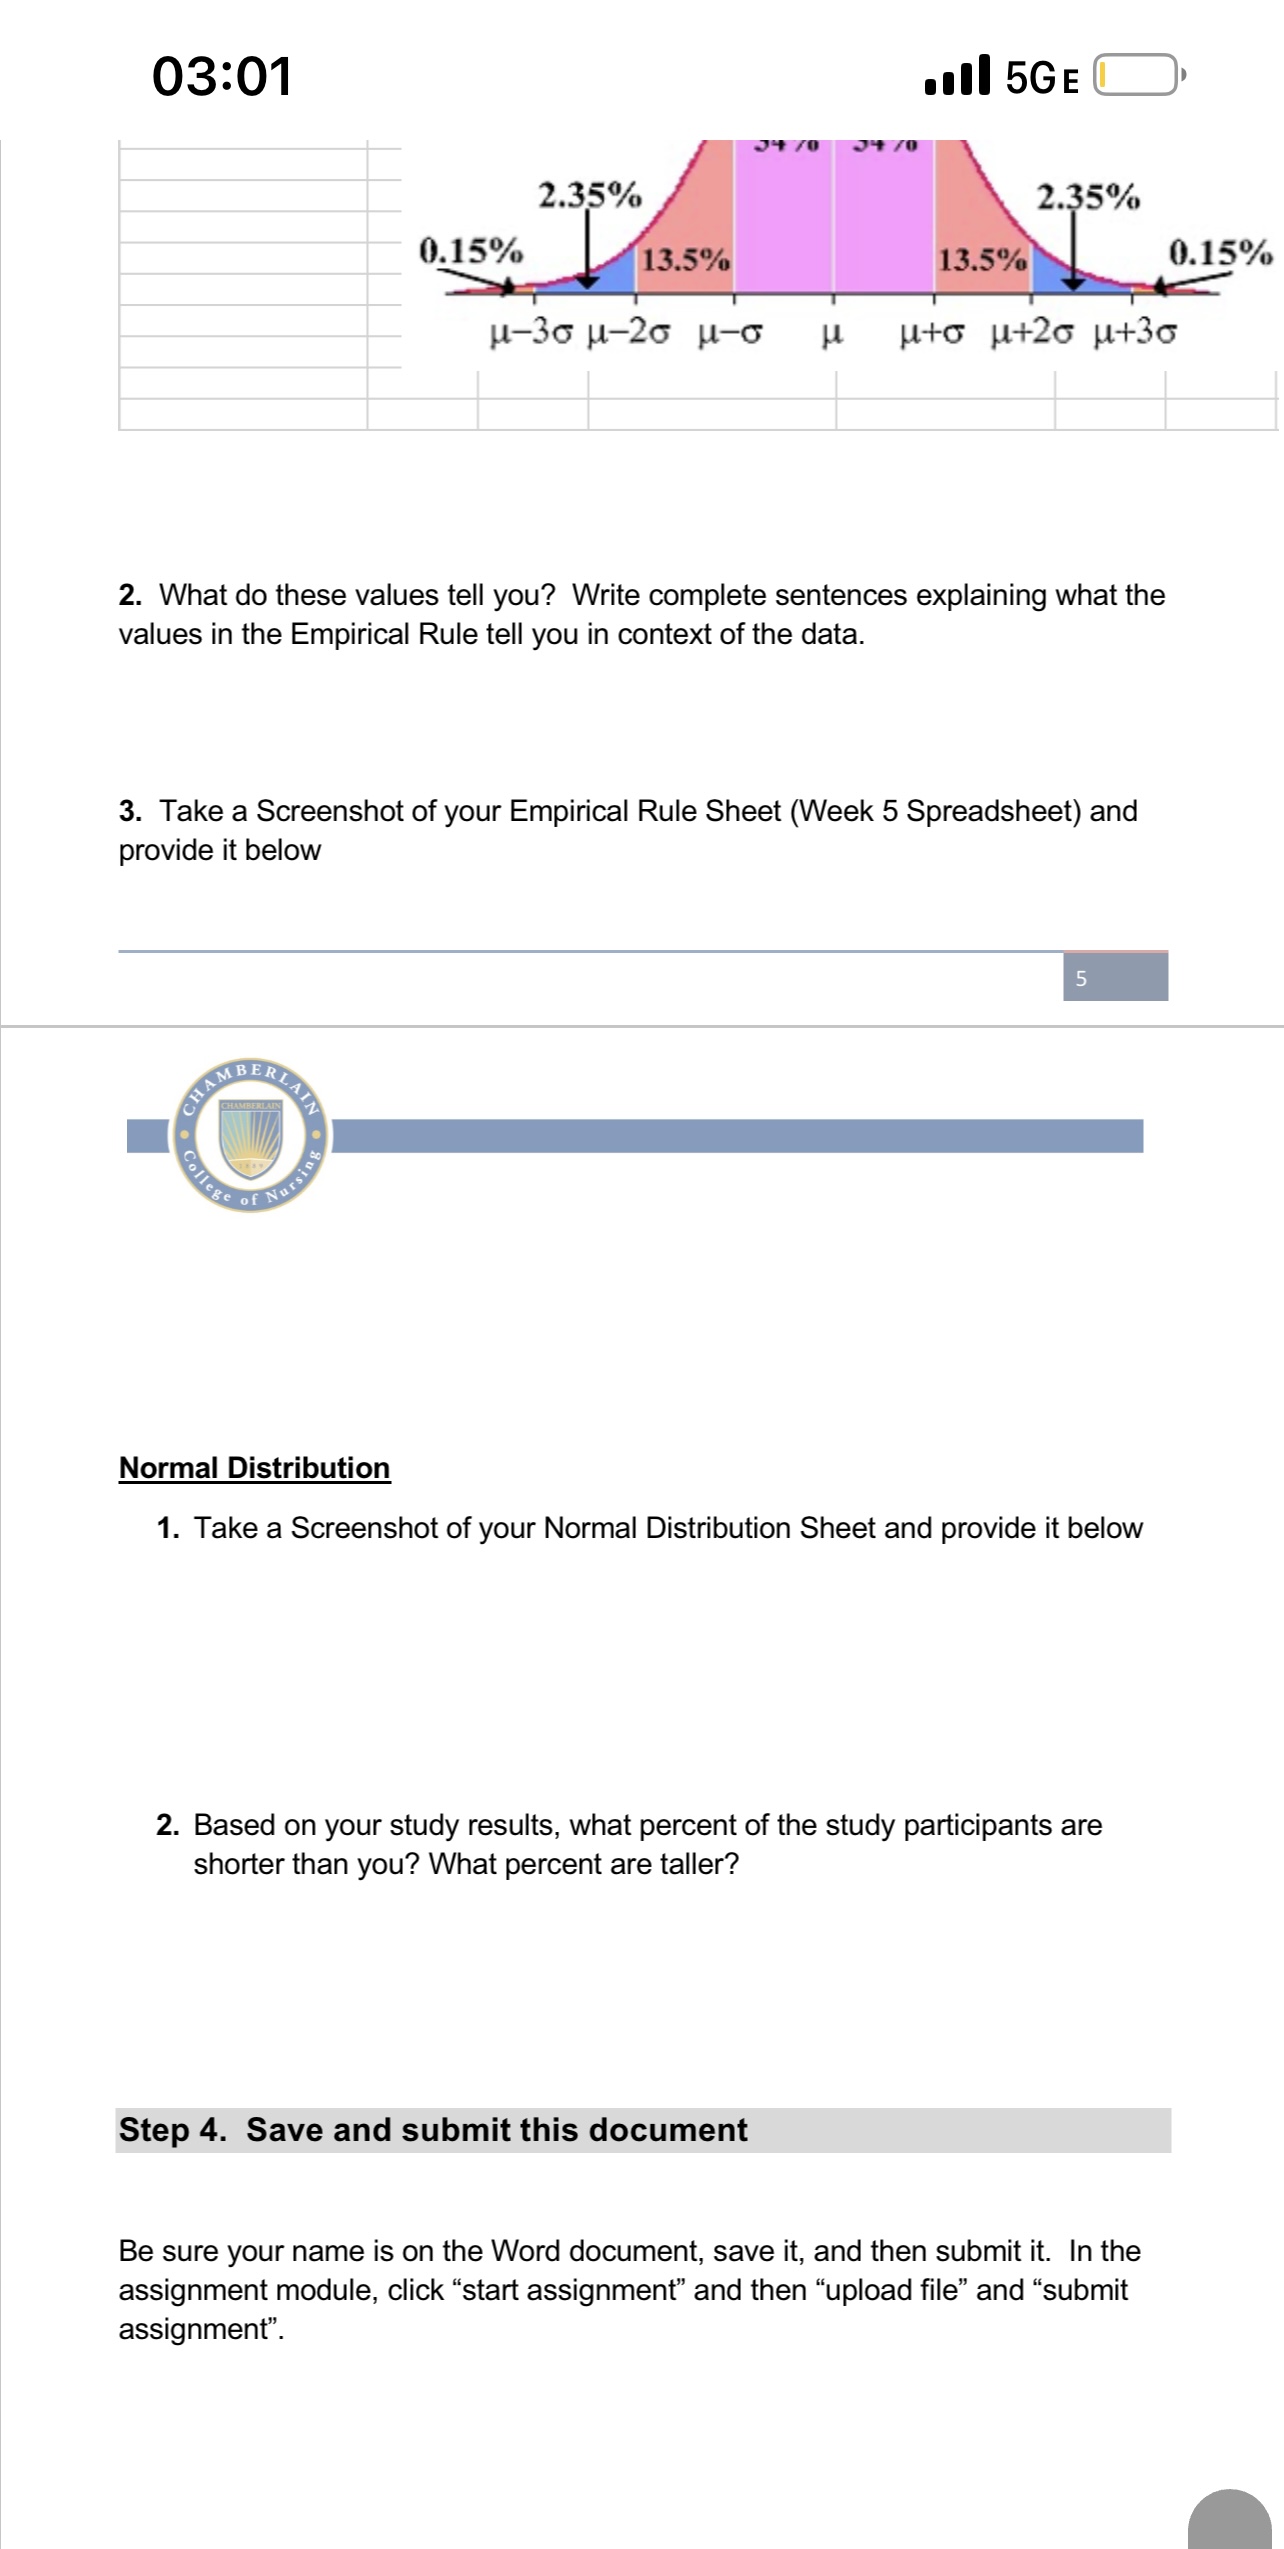
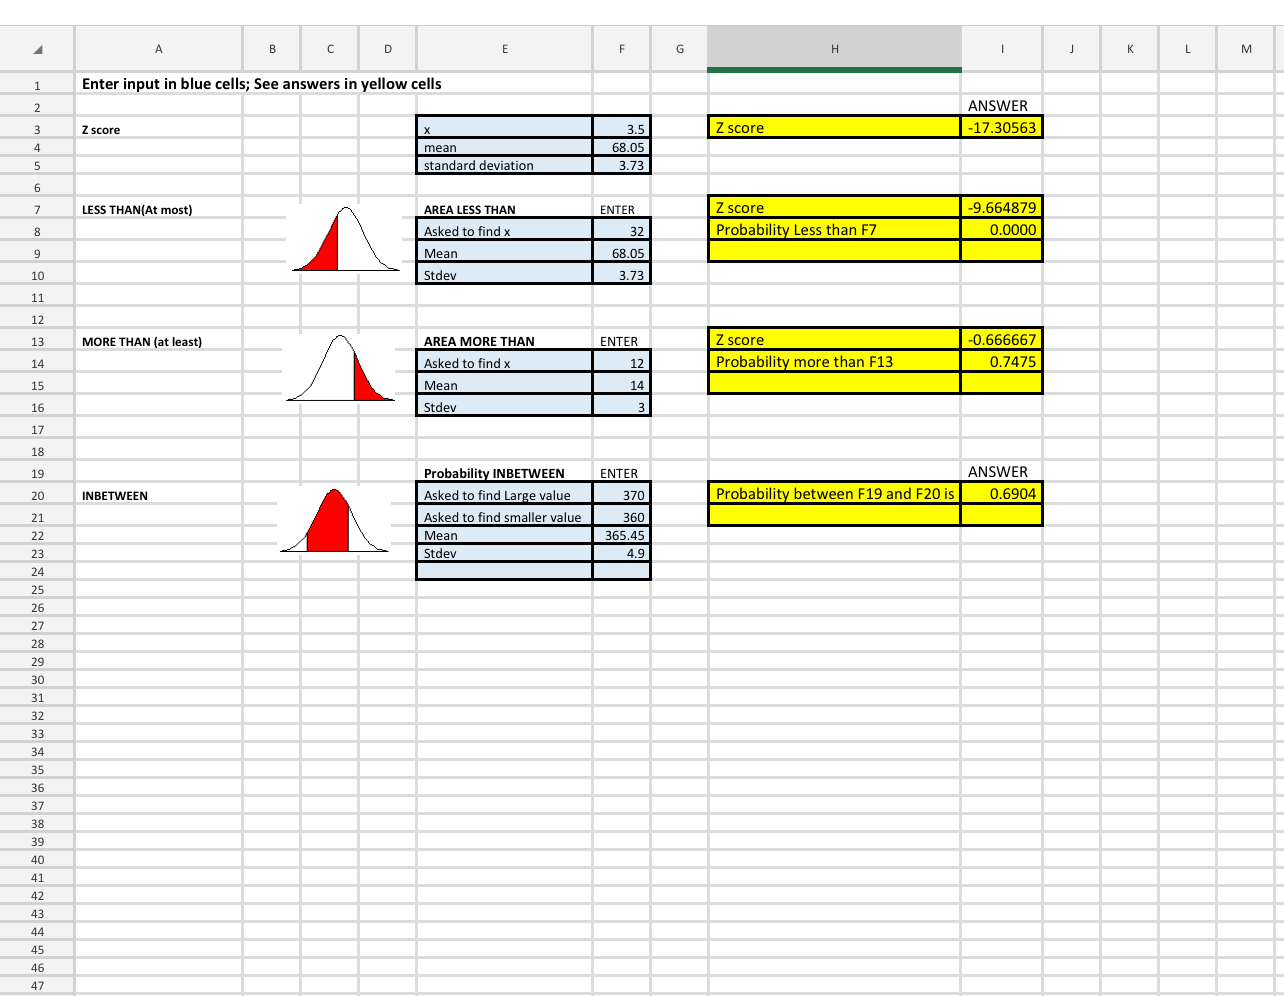
Step 3. Data Analysis Answer the following questions. Use the Week 5 Excel spreadsheets to help analyze the data. Empirical Rule 1. Determine the 68%, 95%, and 99.7% values of the Empirical Rule in terms of the 20 heights in your height study. (Use the Empirical Rule tab from the spreadsheet). 2. What do these values tell you? Write complete sentences explaining what the values in the Empirical Rule tell you in context of the data. 3. Take a Screenshot of your Empirical Rule Sheet (Week 5 Spreadsheet) and provide it below Normal Distribution 1. Take a Screenshot of your Normal Distribution Sheet and provide it below .Based on your study results, what percent of the study participants are shorter than you? What percent are taller? Step 4. Save and submit this document Be sure your name is on the Word document, save it, and then submit it. In the assignment module, click \"start assignment\" and then \"upload file\" and \"submit assignment\". 1 ANSWER Empirical Rule 68-95-99.7 mean 68.05 Lower number Upper number standard deviation 3.73 68% 64.32 71.78 95% 60.59 75.51 99.70% 56.86 79.24 34% 34% 2.35% 2.35% 0.15% 13.5% 13.5% 0.15% H-30 M-20 H-6 4 uto H+20 1+3003:00 wll 5GE( ) Week_5_Lab_Official_Student_Template Q g Q- g i X Name: Instructor Name: Week 5 Lab Assignment Please use this template to help answer the questions listed in the lab instructions. The \"steps\" below refer to the steps listed in the lab instructions. Type your answers and post your screenshots in the spaces given below. Then, save this document with your name and submit it inside the course room. Step 1. Gather Data Your instructors will post 10 data values to use for this lab. The data values represent the HEIGHTS of 10 people. Please reach out to your instructor if you did not receive the assigned 10 data values for the term by Monday of Week 5. (NOTE: This is NOT the data used in the lab video, which is about midterm grades. Do not use the midterm grades data.) Instructor: 59,63,65,66,67,68,68,69,70,70 Mine: 64,70,66,75,69,68,74,72,71,67 1a. Gather 10 MORE of your own to add to the 10 provided by your instructor. Do the following: Survey or measure 10 people to find their heights. Determine the mean and standard deviation for the 20 values by using the Week 3 Excel spreadsheet. (Round statistics to two decimals.) Mean Height in Inches 68.05 Sample Standard Deviation |3.73 in inches 1b. Post a screen shot in the space BELOW of the portion of the spreadsheet that helped you determine these values. Please list the 10 heights your professor provided first followed by the 10 heights you collected. There should be 20 values to determine the mean and sample standard deviation. [ AN Mobile View Read Aloud Headings 03:00 wll 5GE( ) 1b. Post a screen shot in the space BELOW of the portion of the spreadsheet that helped you determine these values. Please list the 10 heights your professor provided first followed by the 10 heights you collected. There should be 20 values to determine the mean and sample standard deviation. ._nter the data in the blue highlighted area and the results will show in the yellow highlighted area. . Mean Median Mode| 680000 (Returns mort Sample Variance Sample Standard Deviation Population Variance Min Lower boundary Quartie 1 Upper boundary Median Identify outiiers in your g ta 1c. Answer the following two questions (Answer in complete sentences). How does your height compare to the mean (average) height of the 20 values? Is your height taller, shorter, or the same as the mean of the sample? Step 2. Data Characteristics Answer the following questions to give some background information on the group of people you used in your study. Write in complete sentences. 1. How did you choosenesmsmamessmpsammmesiiph a t was the sampling 03:00 wll 5GE( ) 1c. Answer the following two questions (Answer in complete sentences). How does your height compare to the mean (average) height of the 20 values? Is your height taller, shorter, or the same as the mean of the sample? Step 2. Data Characteristics Answer the following questions to give some background information on the group of people you used in your study. Write in complete sentences. 1. How did you choose the participants for your study? What was the sampling method: systematic, convenience, cluster, stratified, simple random? 2. What part of the country did your study take place in? 3. What are the age ranges of your participants? 4. How many of each gender did you have in your study? 5. What are other interesting factors about your group? Step 3. Data Analysis Answer the following questions. Use the Week 5 Excel spreadsheets to help analyze the data. Empirical Rule 1. Determine the 68%, 95%, and 99.7% values of the Empirical Rule in terms of the 20 heights in your me tab from the 03:01 all 5Ge() ANSWER | |towernumber [upper number | 0.15% W36 426 H- W P+ P26 pt+3c 2. What do these values tell you? Write complete sentences explaining what the values in the Empirical Rule tell you in context of the data. 3. Take a Screenshot of your Empirical Rule Sheet (Week 5 Spreadsheet) and provide it below Normal Distribution 1. Take a Screenshot of your Normal Distribution Sheet and provide it below 2. Based on your study results, what percent of the study participants are shorter than you? What percent are taller? 03:01 all 5GE( ) 5% 0.15% 0.15% U3 pu-26 p6 W p+c P26 pt3c 2. What do these values tell you? Write complete sentences explaining what the values in the Empirical Rule tell you in context of the data. 3. Take a Screenshot of your Empirical Rule Sheet (Week 5 Spreadsheet) and provide it below Normal Distribution 1. Take a Screenshot of your Normal Distribution Sheet and provide it below 2. Based on your study results, what percent of the study participants are shorter than you? What percent are taller? Step 4. Save and submit this document Be sure your name is on the Word document, save it, and then submit it. In the assignment module, click \"start assignment\" and then \"upload file\" and \"submit assignment\". D E F G H K M Enter input in blue cells; See answers in yellow cells W N K ANSWER Z score 3.5 Z score -17.30563 mean 68.05 standard deviation 3.73 LESS THAN(At most) AREA LESS THAN ENTER Z score -9.664879 8 Asked to find 32 Probability Less than F7 0.0000 9 Mean 58.05 10 Stdev 3.73 11 12 13 MORE THAN (at least) AREA MORE THAN ENTER Z score -0.666667 14 Asked to find 12 Probability more than F13 0.7475 15 Mean 14 16 Stdev 17 18 19 Probability INBETWEEN ENTER ANSWER 20 INBETWEEN Asked to find Large value 370 Probability between F19 and F20 is 0.6904 21 Asked to find smaller value 360 22 Mean 365.45 23 Stdev 49 44 45 46 47
Step by Step Solution
There are 3 Steps involved in it
Step: 1
Get Instant Access to Expert-Tailored Solutions
See step-by-step solutions with expert insights and AI powered tools for academic success
Step: 2
Step: 3
Ace Your Homework with AI
Get the answers you need in no time with our AI-driven, step-by-step assistance