

Answered step by step
Verified Expert Solution
Question
1 Approved Answer
Step #8 - Create a function countRange311 that receives reference to an array of floating point values, a integer indicating how many elements are in
- Step #8 - Create a function countRange311 that receives reference to an array of floating point values, a integer indicating how many elements are in the array and a int minimum and maximum values. The function will return the number of elements (after rounding) between min and max (inclusive). Next, declare an array of 10 integers at the top of the main function. Fill the array with a count of the number of values for each set of tens within the floating point array, i.e. index 0 will contain the count of rounded values in the array 0-9 >TIMES THREE, the second will be 10-19, etc. all the way to 90-99. Use the countRange311 to fill the array.
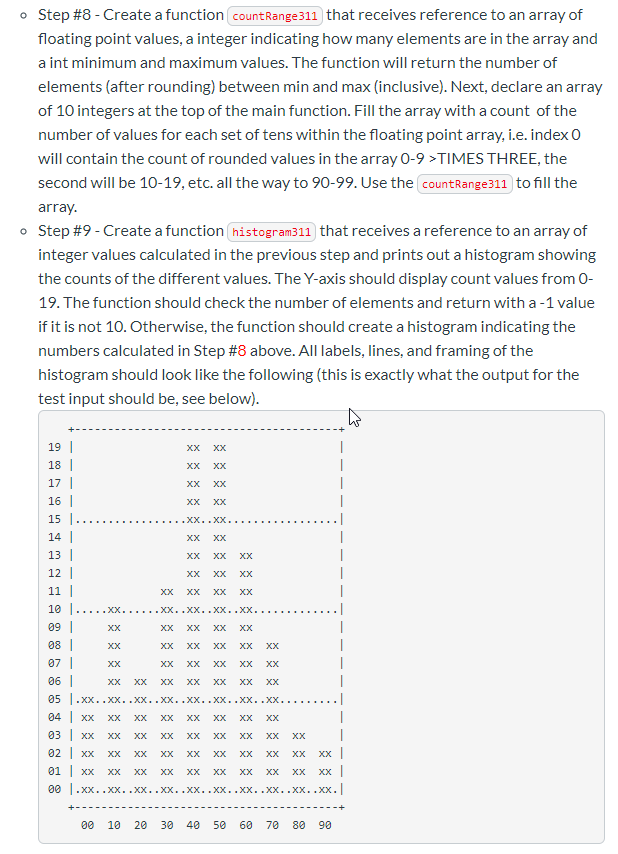
- Step #9 - Create a function histogram311 that receives a reference to an array of integer values calculated in the previous step and prints out a histogram showing the counts of the different values. The Y-axis should display count values from 0-19. The function should check the number of elements and return with a -1 value if it is not 10. Otherwise, the function should create a histogram indicating the numbers calculated in Step #8 above. All labels, lines, and framing of the histogram should look like the following (this is exactly what the output for the test input should be, see below).
Step by Step Solution
There are 3 Steps involved in it
Step: 1

Get Instant Access to Expert-Tailored Solutions
See step-by-step solutions with expert insights and AI powered tools for academic success
Step: 2

Step: 3
Ace Your Homework with AI
Get the answers you need in no time with our AI-driven, step-by-step assistance
Get Started
Modern Database Management
Authors: Jeff Hoffer, Ramesh Venkataraman, Heikki Topi
12th edition
133544613, 978-0133544619