

Answered step by step
Verified Expert Solution
Question
1 Approved Answer
Step by step details, please. CHAPTER 3 Financial Statements and Ratio Analysis 111 LG P3-25 Integrative: Complete ratio analysis Given the following financial statement (following
Step by step details, please.
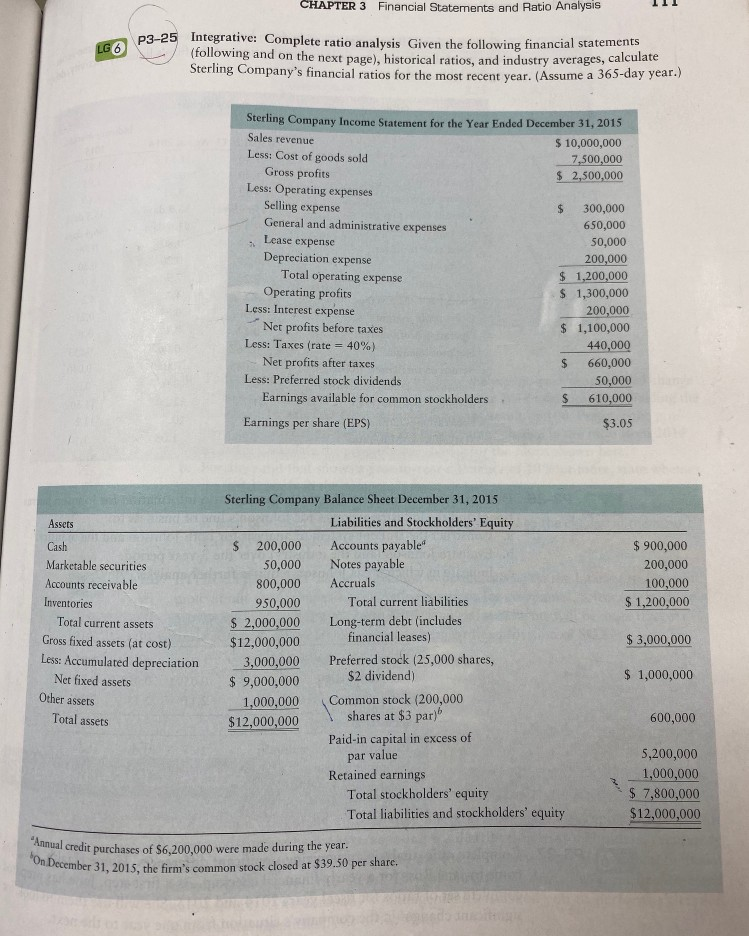
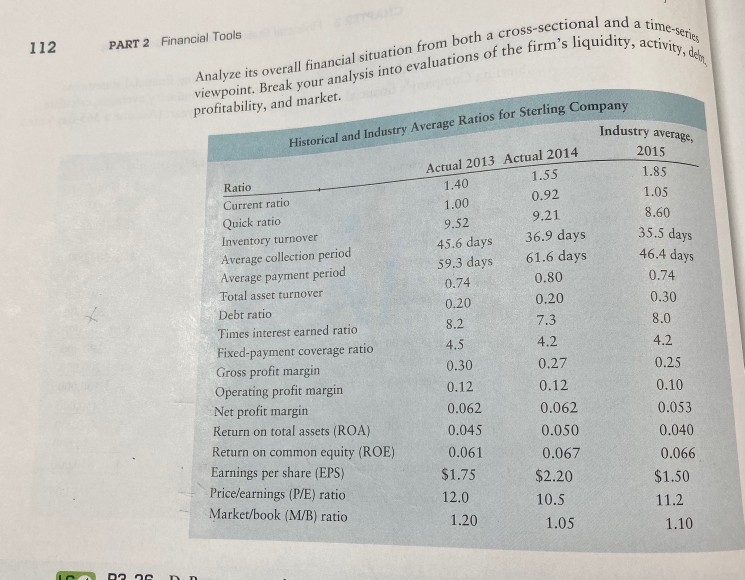
CHAPTER 3 Financial Statements and Ratio Analysis 111 LG P3-25 Integrative: Complete ratio analysis Given the following financial statement (following and on the next panel, historical ratios, and industry averages, calculate Sterling Company's financial ratios for the most recent year. (Assume a 365-day year. Sterling Company Income Statement for the Year Ended December 31, 2015 Sales revenue $ 10,000,000 Less: Cost of goods sold 7,500,000 Gross profits $ 2,500,000 Less: Operating expenses Selling expense $ 300,000 General and administrative expenses 650,000 Lease expense 50,000 Depreciation expense 200,000 Total operating expense $ 1,200,000 Operating profits $ 1,300,000 Less: Interest expense 200,000 Net profits before taxes $ 1,100,000 Less: Taxes (rate = 40%) 440,000 Net profits after taxes $ 660,000 Less: Preferred stock dividends 50,000 Earnings available for common stockholders $ 610,000 Earnings per share (EPS) $3.05 Assets Cash $ 900,000 200,000 100,000 $ 1,200,000 Marketable securities Accounts receivable Inventories Total current assets Gross fixed assets (at cost) Less: Accumulated depreciation Net fixed assets Other assets Total assets $3,000,000 Sterling Company Balance Sheet December 31, 2015 Liabilities and Stockholders' Equity 200,000 Accounts payable" 50,000 Notes payable 800,000 Accruals 950,000 Total current liabilities $ 2,000,000 Long-term debt (includes $12,000,000 financial leases) 3,000,000 Preferred stock (25,000 shares, $ 9,000,000 $2 dividend) 1,000,000 Common stock (200,000 $12,000,000 shares at $3 par) Paid-in capital in excess of par value Retained earnings Total stockholders' equity Total liabilities and stockholders' equity $ 1,000,000 600,000 5,200,000 1,000,000 $ 7,800,000 $12,000,000 On December ual credit purchases of $6,200,000 were made during the year. december 31, 2015, the firm's common stock closed at $39.50 per share. nal and a time-series ity, activity, den 112 PART 2 Financial Tools Analyze its overall financial situation from both a cross-sectional an viewpoint. Break your analysis into evaluations of the firm's liquidity. profitability, and market. Industry average, Historical and Industry Average Ratios for Sterling Company Actual 2013 Actual 2014 1.55 0.92 9.21 36.9 days 61.6 days 0.80 0.20 2015 1.85 1.05 8.60 35.5 days 46.4 days 0.74 0.30 8.0 7.3 Ratio Current ratio Quick ratio Inventory turnover Average collection period Average payment period Total asset turnover Debt ratio Times interest earned ratio Fixed-payment coverage ratio Gross profit margin Operating profit margin Net profit margin Return on total assets (ROA) Return on common equity (ROE) Earnings per share (EPS) Pricelearnings (P/E) ratio Market/book (M/B) ratio 1.40 1.00 9.52 45.6 days 59.3 days 0.74 0.20 8.2 4.5 0.30 0.12 0.062 0.045 0.061 $1.75 12.0 4.2 0.25 0.10 0.053 4.2 0.27 0.12 0.062 0.050 0.067 $2.20 10.5 1.05 0.040 0.066 $1.50 11.2 1.10 1.20 I DOODStep by Step Solution
There are 3 Steps involved in it
Step: 1

Get Instant Access to Expert-Tailored Solutions
See step-by-step solutions with expert insights and AI powered tools for academic success
Step: 2

Step: 3
Ace Your Homework with AI
Get the answers you need in no time with our AI-driven, step-by-step assistance
Get Started
Security Audit And Control Features SAP ERP
Authors: Deloitte Touche Tohmatsu Research Team And Isaca
3rd Edition
1604201150, 978-1604201154