

Answered step by step
Verified Expert Solution
Question
1 Approved Answer
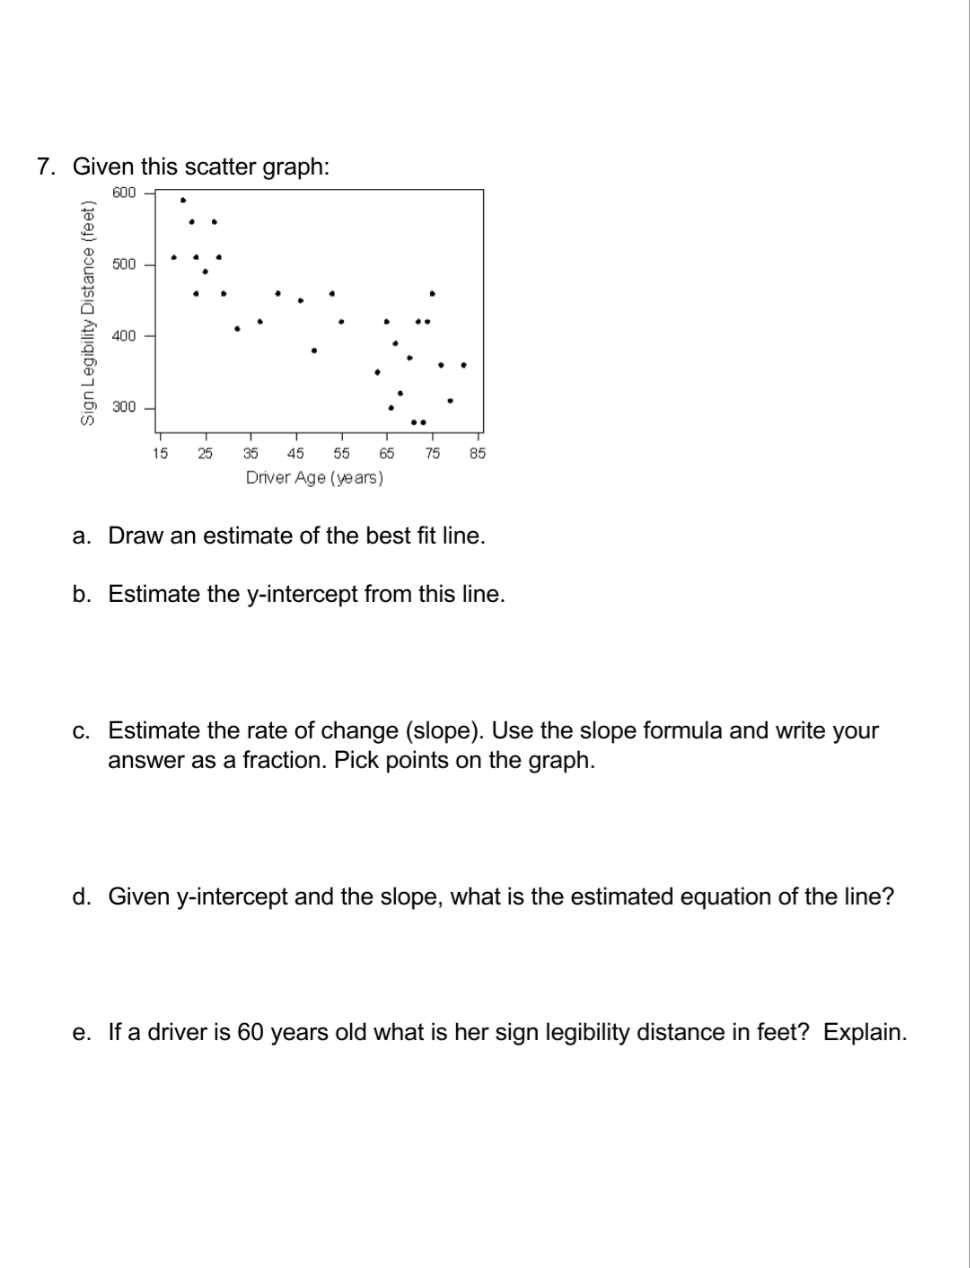
step by step explanations. 7. Given this scatter graph: 63E! 3 a Sign Legibility Distance (feet) a D B c: isasssasssssrsas DrNerAgetyears) a. Draw an
step by step explanations.
Step by Step Solution
There are 3 Steps involved in it
Step: 1

Get Instant Access to Expert-Tailored Solutions
See step-by-step solutions with expert insights and AI powered tools for academic success
Step: 2

Step: 3
Ace Your Homework with AI
Get the answers you need in no time with our AI-driven, step-by-step assistance
Get Started
Financial Algebra advanced algebra with financial applications
Authors: Robert K. Gerver
1st edition
ISBN: 978-1285444857, 128544485X, 978-0357229101, 035722910X, 978-0538449670