

Question
Stevens & Johnson, Inc. Financial Ratio Analysis Montgomery Howell, Vice President for investment analysis at First National Bank of Utah, is looking for a company
Stevens & Johnson, Inc.
Financial Ratio Analysis
Montgomery Howell, Vice President for investment analysis at First National Bank of Utah, is looking for a company to recommend to the banks portfolio committee for inclusion in its buy list for the various trust funds managed by First Nationals trust department. Howells criteria for recommending a company are that it be a good, fundamentally sound, long term prospect and not a hot stock. Since the stock market crash, portfolio returns had been unpredictable. Howell hopes to convince the portfolio committee to take a long term view of the market rather than focus on short term price changes.
Howell recently read an article in the Wall Street Journal concerning Stevens & Johnson, Inc., a toy manufacturer. Stevens & Johnson had posted a six month pretax profit margin of 10 percent. While this was far below the 15% profit margins enjoyed before the market decline, it was far ahead of other companies in the industry. Perhaps Stevens & Johnson was a good long term investment.
The toy industry depended on three main factors for growth: the economy, demographics, and new product innovations on a regular basis. The average life for new products in the toy industry was only one or two Christmas seasons. Companies had two choices to maintain their sales strengths. Either they came up with regular product innovations or they relied on strong standby toys.
Stevens & Johnson had changed its marketing strategy during the past two years. Management was concentrating on its solid performing toys and moving away from the highly risky (yet potentially very profitable) promotional, faddish toys that had dominated the toy market over the most of the past decade. However, for the past two years, shipments of the blockbuster toys had steadily declined, leaving the manufacturers with obsolete inventory and machinery. Two of Stevens & Johnsons three primary competitors had put too much emphasis on blockbuster toys. One was in Chapter 11 bankruptcy and the other had been forced to borrow to stay afloat. Its debt was now 88% of its total capital.
In contrast Stevens & Johnson and the other major competitor had bitten the bullet. They had trimmed overhead, written down inventories, and closed plants with excess capacity. Stevens & Johnson was focusing on its traditional toy line of stable toys, board games, and preschool games.
Today Stevens & Johnson has three new hot prospects for the future. First, the company recently announced the purchase of two operations that produced ride-on toys and outdoor furniture for children. These were expected to compliment Stevens & Johnsons solid array of preschool items. Second, Stevens & Johnson had just signed the toy license on what was expected to be this summers hottest childrens movie. Third Stevens & Johnson was rumored to be planning to enter the video game segment of the industry.
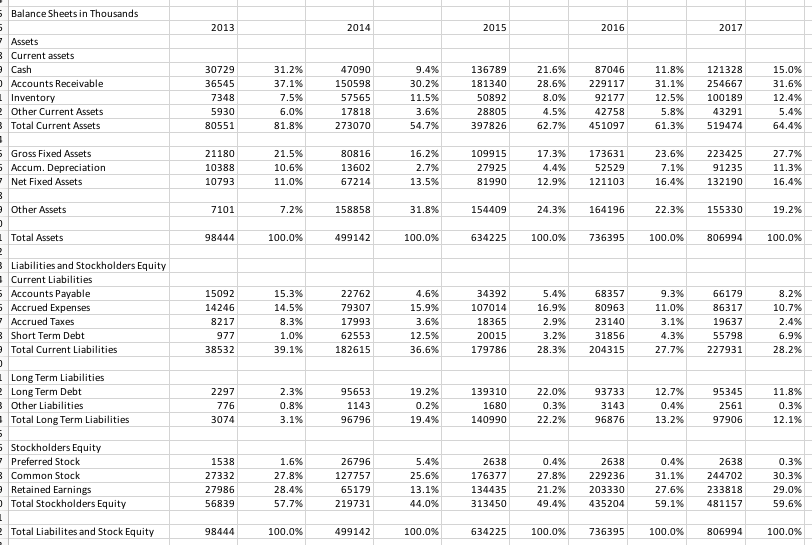
In preparation for the necessary analysis, Howell had collected his financial statements and industry data for the past five years. Exhibit 1 contains company income statements for the five years 2013 through 2017. Exhibit 2 provides comparable balance sheets. Exhibit 3 contains industry average percentage income statements, balance sheets, and ratios as reported by RMA Associates.
Prepare a detailed memo for Mr. Howell, with attached schedules that addresses the following questions:
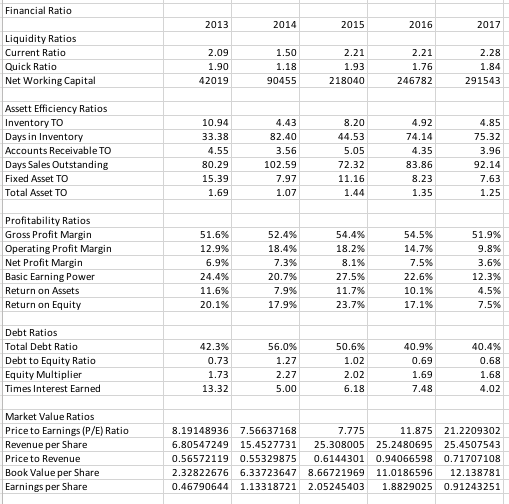
2. Using the financial ratios identify the relevant financial strengths, weaknesses, and trends of the company.
3. Compare the financial results of Stevens & Johnson with the industry and identify and discuss the areas where Stevens & Johnson is stronger or weaker than the industry.
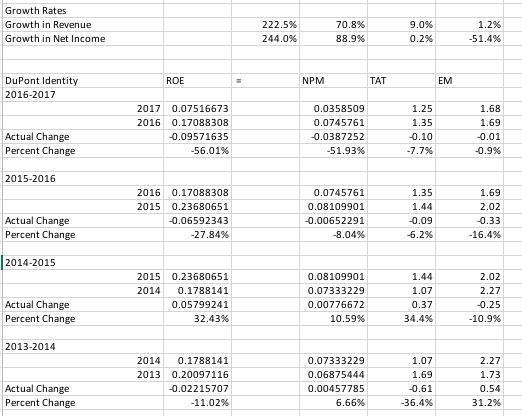
4. Using the DuPont model analyze the return on equity for the past five years. Comment on the strengths and weaknesses uncovered by this analysis.
5. Given this analysis would you recommend Stevens & Johnson be included in First National Banks buy list? Explain why?
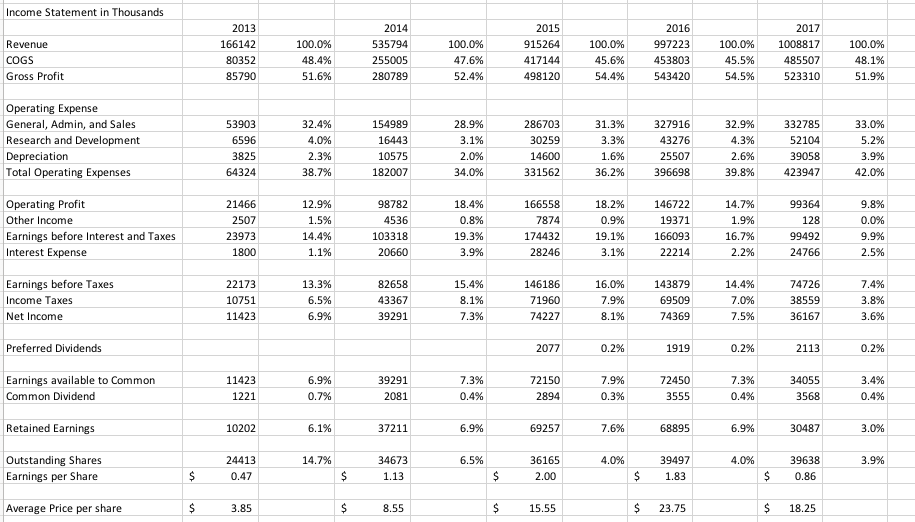
Income Statement in Thousands 2013 166142 2015 915264 417144 498120 2016 997223 Revenue COGS Gross Profit 100.0% 535794 100.0% 47.6% 100.0% 45.6% 100.0% 1008817 100.0% 48.1% 85790 280789 543420 523310 Operating Expense General, Admin, and Sales Research and Development Depreciation Total Operating Expenses 327916 43276 53903 6596 3825 64324 154989 16443 10575 28.9% 286703 30259 14600 331562 32.9% 332785 52104 39058 423947 34.0% 36.2% 396698 39.8% 42.0% 21466 98782 4536 103318 166558 7874 174432 28246 18.2% 146722 19371 166093 22214 14.7% 99364 Operating Profit Other Income Earnings before Interest and Taxes Interest Expense 1.5% 23973 1800 19.3% 16.7% 99492 24766 22173 10751 11423 82658 43367 39291 143879 69509 74369 74726 38559 36167 146186 16.0% Earnings before Taxes Income Taxes Net Income 74227 7.5% Preferred Dividends 2077 1919 Earnings available to Common Common Dividend 39291 72150 2894 72450 3555 11423 7.3% 1221 3568 Retained Earnings 37211 69257 68895 30487 24413 34673 36165 39497 39638 Outstanding Share:s Earnings per Share Average Price per share $15.55 $18.2!5
Step by Step Solution
There are 3 Steps involved in it
Step: 1

Get Instant Access to Expert-Tailored Solutions
See step-by-step solutions with expert insights and AI powered tools for academic success
Step: 2

Step: 3
Ace Your Homework with AI
Get the answers you need in no time with our AI-driven, step-by-step assistance
Get Started
Finance Applications And Theory
Authors: Marcia Cornett, Troy Adair, John Nofsinger
2nd Edition
0073530670, 9780073530673