

Answered step by step
Verified Expert Solution
Question
1 Approved Answer
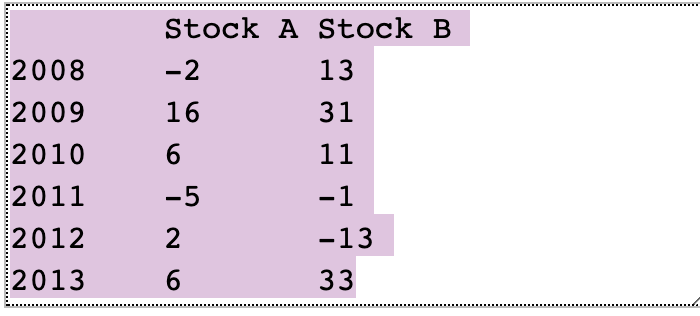
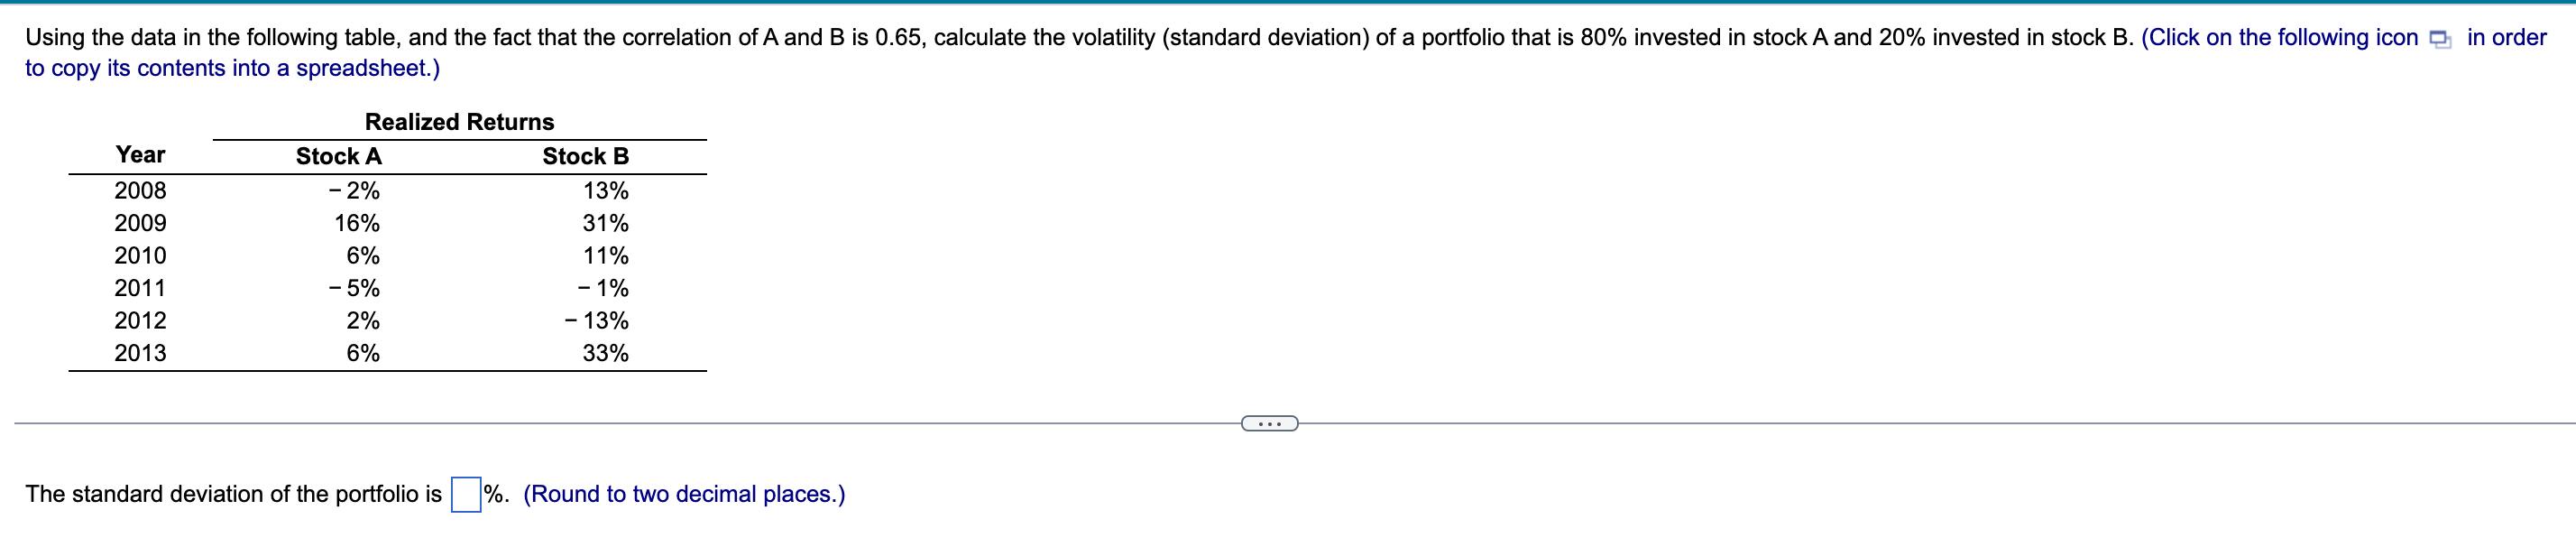
Stock A Stock B -2 13 16 31 6 11 2008 2009 2010 2011 2012 2013 -5 - -1 -13 2 6 33 in order
Step by Step Solution
There are 3 Steps involved in it
Step: 1

Get Instant Access to Expert-Tailored Solutions
See step-by-step solutions with expert insights and AI powered tools for academic success
Step: 2

Step: 3
Ace Your Homework with AI
Get the answers you need in no time with our AI-driven, step-by-step assistance
Get Started
Ebay Tips And Tricks To Increase Your Ebay Sales
Authors: Jessica Wilson
1st Edition
1774854015, 978-1774854013