

Answered step by step
Verified Expert Solution
Question
1 Approved Answer
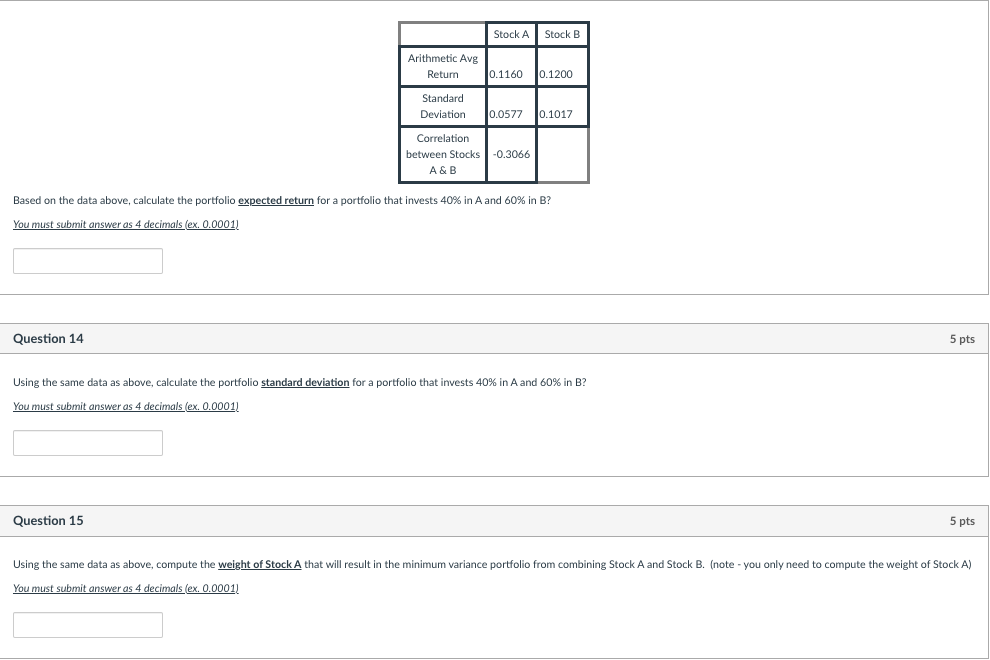
Stock A Stock B Arithmetic Avg Retum 0.1160 10.1200 Standard Deviation 0.0577 10.1017 Correlation between Stocks -0.3066 A&B Based on the data above, calculate the
Step by Step Solution
There are 3 Steps involved in it
Step: 1

Get Instant Access to Expert-Tailored Solutions
See step-by-step solutions with expert insights and AI powered tools for academic success
Step: 2

Step: 3
Ace Your Homework with AI
Get the answers you need in no time with our AI-driven, step-by-step assistance
Get Started
Contemporary Financial Management
Authors: R. Charles Moyer, James R. Mcguigan, William J. Kretlow
9th Edition
032416470X, 9780324164701