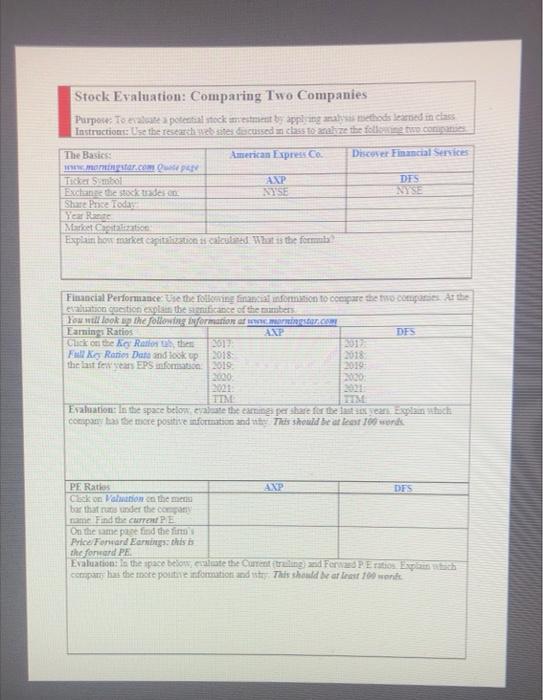
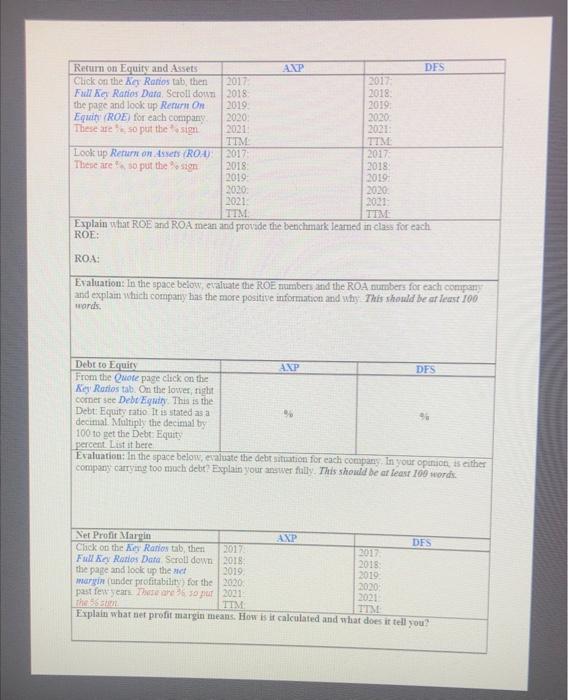
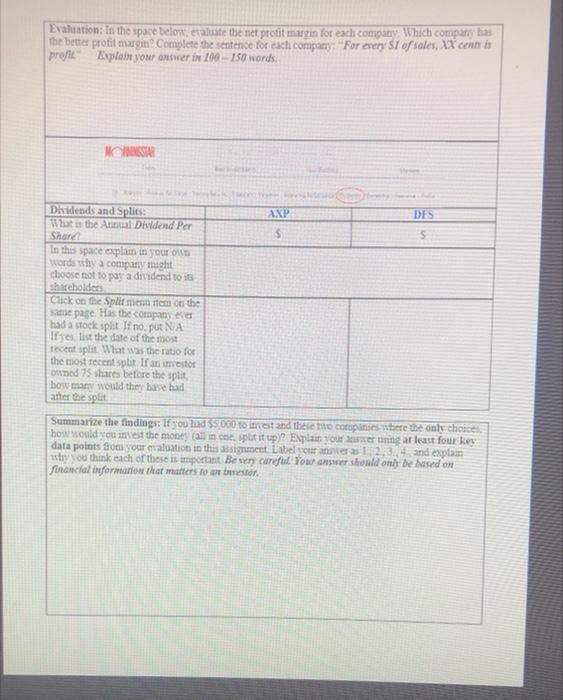
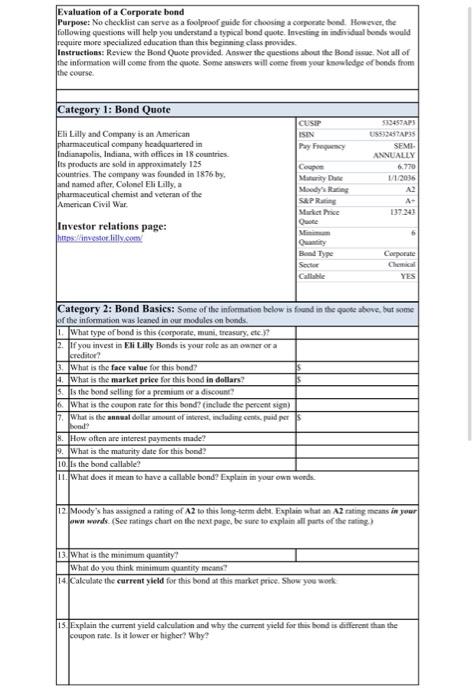
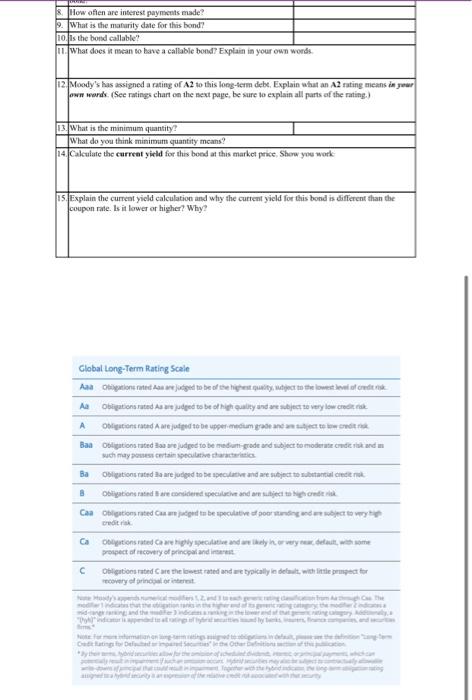
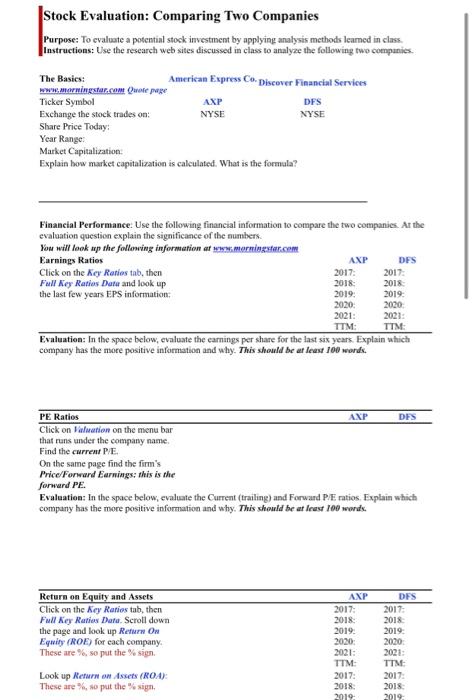
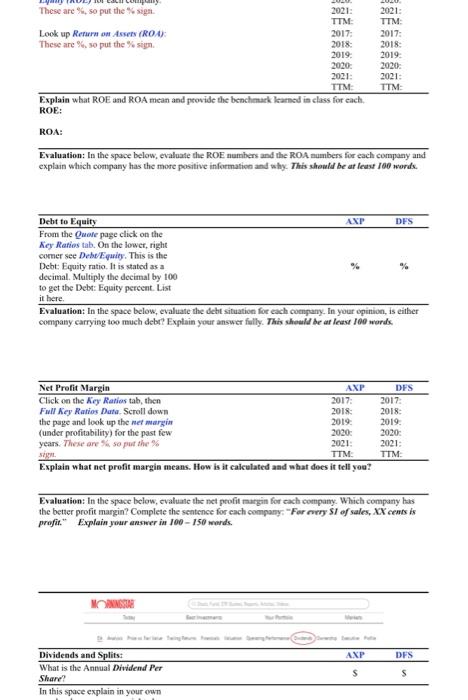
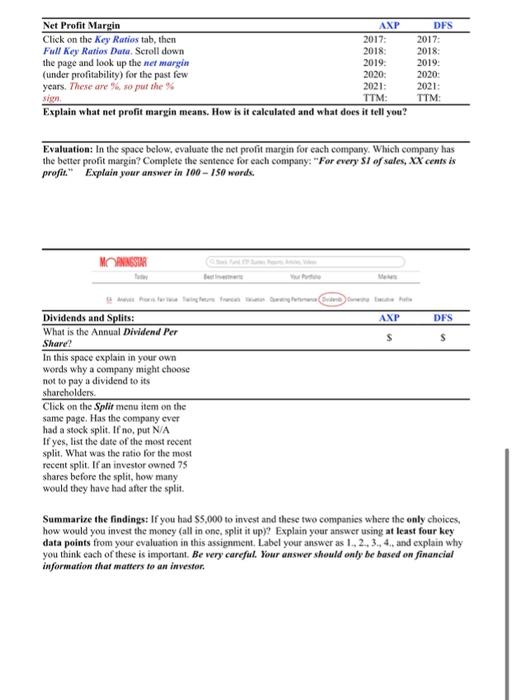
Stock Evaluation: Comparing Two Companies Purpose: To evaluate a potential stock investment by applying analysis methods learned in class Instructions: Use the research web sites discussed in class to analyze the following two companies The Basics: American Express Co. Discover Financial Services www.morningstar.com Quote page Ticket Symbol AXP DES NYSE Exchange the stock trades en NYSE Share Price Today Year Range Market Capitalization Explain how market capitalization is calculated What is the formala Financial Performance Use the following financial information to compare the two companies. At the evaluation question explain the significance of the numbers You will look up the following information at www.morningstar.com Earnings Ratios AXP DES Click on the Key Raios , then 2017- Full Key Ranies Date and look up 2018: 2018. the last few years EPS information 2019 2019 2020: 2021: TIM TTM: Evaluation: In the space below, evaluate the earnings per share for the last six years. Explain which company has the more positive information and why This should be at least 100 words PE Ratios AXP DFS Click on Valuation on the men bar that runs under the company name Find the current PE On the same page find the firm's Price Forward Earnings: this is the forward PE Evaluation: In the space below, evaluate the Current (trailing) and Forward PE ratios. Explain which company has the more poutine information and sty. This should be at least 100 words 2017 2017; 2018: Return on Equity and Assets Click on the Key Ratios tab, then Full Key Ratios Data. Scroll down the page and look up Return On Equity (ROE) for each company. These are so put the sign 2018 2019 2019: 2020 2020: 2021: 2021 TTM TTM 2017 2017: Look up Return on Assets (ROA) These are so put the signi 2018 2018 2019 2019 2020: 2020 2021 2021 TTM TIM Explain what ROE and ROA mean and provide the benchmark learned in class for each ROE: ROA: Evaluation: In the space below, evaluate the ROE numbers and the ROA numbers for each company and explain which company has the more positive information and why This should be at least 100 words. Debt to Equity AXP DFS From the Quote page click on the Key Ratios tab. On the lower, right corner see Debt Equity. This is the Debt: Equity ratio It is stated as a t decimal Multiply the decimal by % 100 to get the Debt: Equity percent List it here Evaluation: In the space below, evaluate the debt situation for each company. In your opinion, is either company carrying too much debt? Explain your answer fully. This should be at least 100 words. Net Profit Margin AXP DES 2017 2017 2018: 2018 2019. 2019 Click on the Key Ratios tab, then Full Key Ratios Data Scroll down the page and look up the met margin (under profitability) for the past few years. These are so put the 56 sten 2020 2020 2021 2021 TIM TTM Explain what net profit margin means. How is it calculated and what does it tell you? AXP DFS. Evaluation: In the space below, evaluate the net profit margin for each company. Which company has the better profit margin? Complete the sentence for each company: "For every $1 of sales, XX cents is profit Explain your answer in 100-150 words. MORNINGSTAR AXP Dividends and Splits: What is the Annual Dividend Per Share DES S In this space explain in your own words why a company might choose not to pay a dividend to its shareholders Click on the Split menu item on the same page. Has the company ever had a stock split. If no, put NA If yes, list the date of the most recent split. What was the ratio for the most recent split If an investor owned 75 shares before the split, bow many would they have had after the split Summarize the findings: If you had $5,000 to invest and these two companies where the only choices. how would you invest the money (all in one, split it up)? Explain your answer uning at least four key data points from your evaluation in this assignment Label your answer as 12,3,4, and explain why you think each of these is important Be very careful Your answer should only be based on financial information that matters to an investor. Evaluation of a Corporate bond Purpose: No checklist can serve as a foolproof guide for choosing a corporate bond. However, the following questions will help you understand a typical bond quote. Investing in individual bonds would require more specialized education than this beginning class provides. Instructions: Review the Bond Quote provided. Answer the questions about the Bond issue. Not all of the information will come from the quote. Some answers will come from your knowledge of bonds from the course. Category 1: Bond Quote CUSIP ISIN 532457APS US532457AP35 Eli Lilly and Company is an American pharmaceutical company headquartered in Indianapolis, Indiana, with offices in 18 countries. Its products are sold in approximately 125 Pay Frequency SEMI- ANNUALLY 6.770 countries. The company was founded in 1876 by. and named after, Colonel Eli Lilly, a Coupon Maturity Date 1/1/2036 Moody's Rating A2 pharmaceutical chemist and veteran of the American Civil War. A+ S&P Rating Market Price Quote 137.243 Investor relations page: https://investor.lilly.com/ 6 Bond Type Corporate Sector Chemical Callable YES Category 2: Bond Basics: Some of the information below is found in the quote above, but some of the information was leaned in our modules on bonds. 1. What type of bond is this (corporate, muni, treasury, etc.)? 2. If you invest in Eli Lilly Bonds is your role as an owner or a creditor? 3. What is the face value for this bond? 4. What is the market price for this bond in dollars? 5. Is the bond selling for a premium or a discount? 6. What is the coupon rate for this bond? (include the percent sign) 7. What is the annual dollar amount of interest, including cents, paid per bond? 8. How often are interest payments made? 9. What is the maturity date for this bond? 10. Is the bond callable? 11. What does it mean to have a callable bond? Explain in your own words. 12 Moody's has assigned a rating of A2 to this long-term debt. Explain what an A2 rating means in your own words. (See ratings chart on the next page, be sure to explain all parts of the rating) 13. What is the minimum quantity? What do you think minimum quantity means? 14. Calculate the current yield for this bond at this market price. Show you work 15. Explain the current yield calculation and why the current yield for this bond is different than the coupon rate. Is it lower or higher? Why? 8. How often are interest payments made? 9. What is the maturity date for this bond? 10. Is the bond callable? 11. What does it mean to have a callable bond? Explain in your own words. 12. Moody's has assigned a rating of A2 to this long-term debt. Explain what an A2 rating means in your own words. (See ratings chart on the next page, be sure to explain all parts of the rating.) 13. What is the minimum quantity? What do you think minimum quantity means? 14. Calculate the current yield for this bond at this market price. Show you work 15. Explain the current yield calculation and why the current yield for this bond is different than the coupon rate. Is it lower or higher? Why? Global Long-Term Rating Scale Aaa Obligation rated Aas are judged to be of the highest quality, subject to the lowest level of credit risk Aa Obligations rated As are judged to be of high quality and are subject to very low credit risk A Obligations rated A are judged to be upper medium grade and are subject to low credit risk Baa Obligationsrated Baa are judged to be medium-grade and subject to moderate credit risk and a such may possess certain speculative characteristics Ba Obligations rated Baare judged to be speculative and are subject to substantial credit 8 Obligations rated are considered speculative and are subject to high credit risk Caa Obligation rated Casare judged to be speculative of poor standing and are subject to very high credit rak Ca Obligations rated ca are highly speculative and are likely in, or very near default with some prospect of recovery of principal and interest C Obligations rated Care the lowest rated and are typically in default, with little prospect for recovery of principal or inter ody's numerical moders 1,2, and to getting delication from Aah C moderndicates that the obligation ranks mid-range ranking and t Ehting ca "TA" Sim minormation on Dadating for Defuted or impared Secut obligations in defaut, p Other Definitions s des town of permigal that should result i incity an Together with h the relative a ication unpa Stock Evaluation: Comparing Two Companies Purpose: To evaluate a potential stock investment by applying analysis methods learned in class. Instructions: Use the research web sites discussed in class to analyze the following two companies. The Basics: American Express Co-Discover Financial Services www.morningstar.com Quote page Ticker Symbol AXP DFS Exchange the stock trades on: NYSE NYSE Share Price Today: Year Range: Market Capitalization: Explain how market capitalization is calculated. What is the formula? Financial Performance: Use the following financial information to compare the two companies. At the evaluation question explain the significance of the numbers. You will look up the following information at www.morningstar.com Earnings Ratios AXP DFS Click on the Key Ratios tab, then 2017: 2017: Full Key Ratios Data and look up 2018: 2018: the last few years EPS information: 2019: 2019: 2020: 2020: 2021: 2021: TTM: TTM: Evaluation: In the space below, evaluate the earnings per share for the last six years. Explain which company has the more positive information and why. This should be at least 100 words. PE Ratios AXP DFS Click on Valuation on the menu bar that runs under the company name. Find the current P/E. On the same page find the firm's Price/Forward Earnings: this is the forward PE. Evaluation: In the space below, evaluate the Current (trailing) and Forward P/E ratios. Explain which company has the more positive information and why. This should be at least 100 words. Return on Equity and Assets AXP DFS Click on the Key Ratios tab, then Full Key Ratios Data. Scroll down the page and look up Return On Equity (ROE) for each com These are %, so put the % sign. Look up Return on Assets (ROA): These are %, so put the % sign. 2017: 2018: 2019: 2020: 2021: TTM: 2017: 2018: 2019 2017: 2018: 2019: 2020 2021: TTM: 2017: 2018: 2019 These are %, so put the % sign. 2021: 2021: TTM: TTM: 2017: 2017: Look up Return on Assets (ROA) These are %, so put the % sign. 2018: 2018: 2019: 2019: 2020: 2020: 2021: 2021: TTM: TTM: Explain what ROE and ROA mean and provide the benchmark learned in class for each. ROE: ROA: Evaluation: In the space below, evaluate the ROE numbers and the ROA numbers for each company and explain which company has the more positive information and why. This should be at least 100 words. Debt to Equity AXP DFS From the Quote page click on the Key Ratios tab. On the lower, right comer see Debe/Equity. This is the Debt: Equity ratio. It is stated as a decimal. Multiply the decimal by 100 to get the Debt: Equity percent. List it here. Evaluation: In the space below, evaluate the debt situation for each company. In your opinion, is either company carrying too much debt? Explain your answer fully. This should be at least 100 words. Net Profit Margin AXP DFS 2017: 2017: Click on the Key Ratios tab, then Full Key Ratios Data. Scroll down 2018: 2018: 2019: 2019: 2020: 2020: the page and look up the net margin (under profitability) for the past few years. These are % so put the % sign. 2021: 2021: TTM: TTM: Explain what net profit margin means. How is it calculated and what does it tell you? Evaluation: In the space below, evaluate the net profit margin for each company. Which company has the better profit margin? Complete the sentence for each company: "For every S1 of sales, XX cents is profit." Explain your answer in 100-150 words. ORNINGSTAR mie Dividends and Splits: AXP DES What is the Annual Dividend Per Share? $ S In this space explain in your own Net Profit Margin 2017: 2017: 2018: 2018: Click on the Key Ratios tab, then Full Key Ratios Data. Scroll down the page and look up the net margin (under profitability) for the past few years. These are %, so put the % 2019: 2019: 2020: 2020: 2021: 2021: sign. TTM: TTM: Explain what net profit margin means. How is it calculated and what does it tell you? Evaluation: In the space below, evaluate the net profit margin for each company. Which company has the better profit margin? Complete the sentence for each company: "For every $1 of sales, XX cents is profit." Explain your answer in 100-150 words. ANINGSTAR Mes Dividends and Splits: AXP DFS What is the Annual Dividend Per Share? S $ In this space explain in your own words why a company might choose not to pay a dividend to its shareholders. Click on the Split menu item on the same page. Has the company ever had a stock split. If no, put N/A If yes, list the date of the most recent split. What was the ratio for the most recent split. If an investor owned 75 shares before the split, how many would they have had after the split. Summarize the findings: If you had $5,000 to invest and these two companies where the only choices, how would you invest the money (all in one, split it up)? Explain your answer using at least four key data points from your evaluation in this assignment. Label your answer as 1., 2., 3., 4., and explain why you think each of these is important. Be very careful. Your answer should only be based on financial information that matters to an investor. AXP DFS ill T-Mobile Wi-Fi 2:46 AM Evaluation and Comparison of two f... Evaluation and Comparison of Funds Instructions: For your research, you will use www.morningstar.com (search for fund symbol) Both options seek growth through exposure in the U.S. Stock Market. In your analysis you will decide which option is best for the stock portion of your investment portfolio. Assume you have $3,000 to invest. Fund Name Vanguard Explorer Inv. Bridgeway Small-Cap Value VEXPX BRSVX Fund Symbol Investment Style Total Assets of the Fund y Minimum Initial Investment ( b The focus of this fund is investment in what size companies? Fund Expenses & Fees (Pri Does the fund have a front load? Does the fund have a redemption or deferred Load? Net Expense Ratio the, on Quate page listed expense rates % Analysis point: For each fund, on a $3,000 investment, how much of your money will go to expenses each year? (show the math) Diversification Pr % US Stock % US Stock The asset allocation chart shows the percent of fund money invested in different types of securities. What percent is invested in U.S. quity? How many different Equity Holdings does the fand include quity (stock) holdings #eputy (sck) holdings Port to the scroll down to Holdings List the fund's five largest holdings Company Name and the portfolio weight of each Annual Turnover rate 45% What does turnover mean? Which and has the most desirable umover? Be detailed in your answer. Fund Symbol VEXPX Fund Management People a Date of fand inception OF 00 To Do Dashboard 199 Calendar 23 % Company Name 773% 91% BRSVX Notifications Inbox T-Mobile Wi-Fi 2:46 AM Evaluation and Comparison of two f... 91% Annual Turnover rate What does turnover mean? Which and has the most desirable urnover? Be detailed in your answer. Fund Symbol VEXPX BRSVX Fund Management (People) Date of fand inception How many managers run the fund? What is the average temure and the Jongest tenure of the fund managers? Fund Performance On Morningstar.com click on the performance tab, scroll down to trailing returns Look at the total return % for the investment for each time frame, the numbers are percentages Fund performance over last 3 years Fund performance over last 5 years % Fund performance over last 10 years Fund performance over last 15 years Analysis point: Which find has the better performance over the past 3, 5, 10 & 15 years? Note: each percentage is an verge per year over the ghe number of years) Not Mongstar Performance fons, expressed in percentage terms are determined by taking the change in price ng applicable, all income and capital gas distribut during the period and devading by the starting price Unless otherwise noted Morning does not adjust total returns for sales cherges (such as front-end loads defend and redemption fees, preferring to give a clearer picture of performance Total returns de account for the expense asis, which includes management, administrative, 126-1 fees and other costs that are taken set of aout Thes, tive hos, and 15-year tet Net Asset Value (Quate tab) Net Asset Value do not lost soal asset TTM aling ve month Yield Analysis point: Explain why these two funds have a relatively low yield compared to other funds Based on the above information, explain which of these two funds would best help you achieve your investment goals? Explain your answer IN DETAIL. here using at least four pieces of information from above to justify your answer. Number your answers 1, 2, 3, and 4 You should have a short paragraph for each of the four, explaining why each piece of information is important for your decision. 23 Dashboard Calendar Notifications Inbox 773% OF DE To Do Evaluation and Comparison of Funds Instructions: For your research, you will use www.morningstar.com (search for fund symbol) Both options seek growth through exposure in the U.S. Stock Market. In your analysis you will decide which option is best for the stock portion of your investment portfolio. Assume you have $3,000 to invest. Fund Name Vanguard Explorer Inv. Bridgeway Small-Cap Value VEXPX BRSVX Fund Symbol Investment Style Total Assets of the Fund Quote tab) Minimum Initial Investment (Quote aby The focus of this fund is investm in what size companies? Fund Expenses & Fees (Price tab) Does the fund have a front load? Does the fund have a redemption or deferred Load? Net Expense Ratio % Also, on Quote page listed as adj. expense ratio) Analysis point: For each fund, on a $3,000 investment, how much of your money will go to expenses each year? (show the math) %US Stock Diversification (Portfolio tab) The asset allocation chart shows the percent of fund money invested in different types of securities. What percent is invested in U.S. equity? How many different Equity Holdings does the fund include? #equity (stock) holdings (Portfolio tab, then scroll down to Holdings) List the fund's five largest holdings Company Name and the portfolio weight of each: Annual Turnover rate 45% What does turnover mean? Which fund has the most desirable turnover? Be detailed in your answer. Fund Symbol VEXPX Fund Management (People tab) % % US Stock e equity (stock) holdings % Company Name 91% BRSVX What does turnover mean? Which fund has the most desirable turnover? Be detailed in your answer. Fund Symbol VEXPX BRSVX Fund Management (People tab) Date of fund inception How many managers run the fund? What is the average tenure and the longest tenure of the fund managers? Fund Performance (On Morningstar.com click on the performance tab, scroll down to trailing returns. Look at the total return % for the investment for each time frame, the numbers are percentages) Fund performance over last 3 years % % % Fund performance over last 5 years Fund performance over last 10 years Fund performance over last 15 years Analysis point: Which fund has the better performance over the past 3, 5, 10 & 15 years? (Note: each percentage is an average per year over the given number of years) Note: Morningstar Performance figures, expressed in percentage terms, are determined by taking the change in price, reinvesting, if applicable, all income and capital gains distributions during the period, and dividing by the starting price. Unless otherwise noted, Morningstar does not adjust total returns for sales charges fnach as front-end loads, deferred loads, and redemption fees), preferring to give a clearer picture of performance. Total returns de account for the expense ratio, which includes management, administrative, 12b-1 fees and other costs that are taken out of assets. Three, five. ten, and 15-year returns are annualized. Net Asset Value (Quote tab) Net Asset Value S (do not list total assets) % TTM (trailing twelve month) Yield Analysis point: Explain why these two funds have a relatively low yield compared to other funds. Based on the above information, explain which of these two funds would best help you achieve your investment goals? Explain your answer IN DETAIL here using at least four pieces of information from above to justify your answer. Number your answers 1, 2, 3, and 4. You should have a short paragraph for each of the four, explaining why each piece of information is important for your decision. Stock Evaluation: Comparing Two Companies Purpose: To evaluate a potential stock investment by applying analysis methods learned in class Instructions: Use the research web sites discussed in class to analyze the following two companies The Basics: American Express Co. Discover Financial Services www.morningstar.com Quote page Ticket Symbol AXP DES NYSE Exchange the stock trades en NYSE Share Price Today Year Range Market Capitalization Explain how market capitalization is calculated What is the formala Financial Performance Use the following financial information to compare the two companies. At the evaluation question explain the significance of the numbers You will look up the following information at www.morningstar.com Earnings Ratios AXP DES Click on the Key Raios , then 2017- Full Key Ranies Date and look up 2018: 2018. the last few years EPS information 2019 2019 2020: 2021: TIM TTM: Evaluation: In the space below, evaluate the earnings per share for the last six years. Explain which company has the more positive information and why This should be at least 100 words PE Ratios AXP DFS Click on Valuation on the men bar that runs under the company name Find the current PE On the same page find the firm's Price Forward Earnings: this is the forward PE Evaluation: In the space below, evaluate the Current (trailing) and Forward PE ratios. Explain which company has the more poutine information and sty. This should be at least 100 words 2017 2017; 2018: Return on Equity and Assets Click on the Key Ratios tab, then Full Key Ratios Data. Scroll down the page and look up Return On Equity (ROE) for each company. These are so put the sign 2018 2019 2019: 2020 2020: 2021: 2021 TTM TTM 2017 2017: Look up Return on Assets (ROA) These are so put the signi 2018 2018 2019 2019 2020: 2020 2021 2021 TTM TIM Explain what ROE and ROA mean and provide the benchmark learned in class for each ROE: ROA: Evaluation: In the space below, evaluate the ROE numbers and the ROA numbers for each company and explain which company has the more positive information and why This should be at least 100 words. Debt to Equity AXP DFS From the Quote page click on the Key Ratios tab. On the lower, right corner see Debt Equity. This is the Debt: Equity ratio It is stated as a t decimal Multiply the decimal by % 100 to get the Debt: Equity percent List it here Evaluation: In the space below, evaluate the debt situation for each company. In your opinion, is either company carrying too much debt? Explain your answer fully. This should be at least 100 words. Net Profit Margin AXP DES 2017 2017 2018: 2018 2019. 2019 Click on the Key Ratios tab, then Full Key Ratios Data Scroll down the page and look up the met margin (under profitability) for the past few years. These are so put the 56 sten 2020 2020 2021 2021 TIM TTM Explain what net profit margin means. How is it calculated and what does it tell you? AXP DFS. Evaluation: In the space below, evaluate the net profit margin for each company. Which company has the better profit margin? Complete the sentence for each company: "For every $1 of sales, XX cents is profit Explain your answer in 100-150 words. MORNINGSTAR AXP Dividends and Splits: What is the Annual Dividend Per Share DES S In this space explain in your own words why a company might choose not to pay a dividend to its shareholders Click on the Split menu item on the same page. Has the company ever had a stock split. If no, put NA If yes, list the date of the most recent split. What was the ratio for the most recent split If an investor owned 75 shares before the split, bow many would they have had after the split Summarize the findings: If you had $5,000 to invest and these two companies where the only choices. how would you invest the money (all in one, split it up)? Explain your answer uning at least four key data points from your evaluation in this assignment Label your answer as 12,3,4, and explain why you think each of these is important Be very careful Your answer should only be based on financial information that matters to an investor. Evaluation of a Corporate bond Purpose: No checklist can serve as a foolproof guide for choosing a corporate bond. However, the following questions will help you understand a typical bond quote. Investing in individual bonds would require more specialized education than this beginning class provides. Instructions: Review the Bond Quote provided. Answer the questions about the Bond issue. Not all of the information will come from the quote. Some answers will come from your knowledge of bonds from the course. Category 1: Bond Quote CUSIP ISIN 532457APS US532457AP35 Eli Lilly and Company is an American pharmaceutical company headquartered in Indianapolis, Indiana, with offices in 18 countries. Its products are sold in approximately 125 Pay Frequency SEMI- ANNUALLY 6.770 countries. The company was founded in 1876 by. and named after, Colonel Eli Lilly, a Coupon Maturity Date 1/1/2036 Moody's Rating A2 pharmaceutical chemist and veteran of the American Civil War. A+ S&P Rating Market Price Quote 137.243 Investor relations page: https://investor.lilly.com/ 6 Bond Type Corporate Sector Chemical Callable YES Category 2: Bond Basics: Some of the information below is found in the quote above, but some of the information was leaned in our modules on bonds. 1. What type of bond is this (corporate, muni, treasury, etc.)? 2. If you invest in Eli Lilly Bonds is your role as an owner or a creditor? 3. What is the face value for this bond? 4. What is the market price for this bond in dollars? 5. Is the bond selling for a premium or a discount? 6. What is the coupon rate for this bond? (include the percent sign) 7. What is the annual dollar amount of interest, including cents, paid per bond? 8. How often are interest payments made? 9. What is the maturity date for this bond? 10. Is the bond callable? 11. What does it mean to have a callable bond? Explain in your own words. 12 Moody's has assigned a rating of A2 to this long-term debt. Explain what an A2 rating means in your own words. (See ratings chart on the next page, be sure to explain all parts of the rating) 13. What is the minimum quantity? What do you think minimum quantity means? 14. Calculate the current yield for this bond at this market price. Show you work 15. Explain the current yield calculation and why the current yield for this bond is different than the coupon rate. Is it lower or higher? Why? 8. How often are interest payments made? 9. What is the maturity date for this bond? 10. Is the bond callable? 11. What does it mean to have a callable bond? Explain in your own words. 12. Moody's has assigned a rating of A2 to this long-term debt. Explain what an A2 rating means in your own words. (See ratings chart on the next page, be sure to explain all parts of the rating.) 13. What is the minimum quantity? What do you think minimum quantity means? 14. Calculate the current yield for this bond at this market price. Show you work 15. Explain the current yield calculation and why the current yield for this bond is different than the coupon rate. Is it lower or higher? Why? Global Long-Term Rating Scale Aaa Obligation rated Aas are judged to be of the highest quality, subject to the lowest level of credit risk Aa Obligations rated As are judged to be of high quality and are subject to very low credit risk A Obligations rated A are judged to be upper medium grade and are subject to low credit risk Baa Obligationsrated Baa are judged to be medium-grade and subject to moderate credit risk and a such may possess certain speculative characteristics Ba Obligations rated Baare judged to be speculative and are subject to substantial credit 8 Obligations rated are considered speculative and are subject to high credit risk Caa Obligation rated Casare judged to be speculative of poor standing and are subject to very high credit rak Ca Obligations rated ca are highly speculative and are likely in, or very near default with some prospect of recovery of principal and interest C Obligations rated Care the lowest rated and are typically in default, with little prospect for recovery of principal or inter ody's numerical moders 1,2, and to getting delication from Aah C moderndicates that the obligation ranks mid-range ranking and t Ehting ca "TA" Sim minormation on Dadating for Defuted or impared Secut obligations in defaut, p Other Definitions s des town of permigal that should result i incity an Together with h the relative a ication unpa Stock Evaluation: Comparing Two Companies Purpose: To evaluate a potential stock investment by applying analysis methods learned in class. Instructions: Use the research web sites discussed in class to analyze the following two companies. The Basics: American Express Co-Discover Financial Services www.morningstar.com Quote page Ticker Symbol AXP DFS Exchange the stock trades on: NYSE NYSE Share Price Today: Year Range: Market Capitalization: Explain how market capitalization is calculated. What is the formula? Financial Performance: Use the following financial information to compare the two companies. At the evaluation question explain the significance of the numbers. You will look up the following information at www.morningstar.com Earnings Ratios AXP DFS Click on the Key Ratios tab, then 2017: 2017: Full Key Ratios Data and look up 2018: 2018: the last few years EPS information: 2019: 2019: 2020: 2020: 2021: 2021: TTM: TTM: Evaluation: In the space below, evaluate the earnings per share for the last six years. Explain which company has the more positive information and why. This should be at least 100 words. PE Ratios AXP DFS Click on Valuation on the menu bar that runs under the company name. Find the current P/E. On the same page find the firm's Price/Forward Earnings: this is the forward PE. Evaluation: In the space below, evaluate the Current (trailing) and Forward P/E ratios. Explain which company has the more positive information and why. This should be at least 100 words. Return on Equity and Assets AXP DFS Click on the Key Ratios tab, then Full Key Ratios Data. Scroll down the page and look up Return On Equity (ROE) for each com These are %, so put the % sign. Look up Return on Assets (ROA): These are %, so put the % sign. 2017: 2018: 2019: 2020: 2021: TTM: 2017: 2018: 2019 2017: 2018: 2019: 2020 2021: TTM: 2017: 2018: 2019 These are %, so put the % sign. 2021: 2021: TTM: TTM: 2017: 2017: Look up Return on Assets (ROA) These are %, so put the % sign. 2018: 2018: 2019: 2019: 2020: 2020: 2021: 2021: TTM: TTM: Explain what ROE and ROA mean and provide the benchmark learned in class for each. ROE: ROA: Evaluation: In the space below, evaluate the ROE numbers and the ROA numbers for each company and explain which company has the more positive information and why. This should be at least 100 words. Debt to Equity AXP DFS From the Quote page click on the Key Ratios tab. On the lower, right comer see Debe/Equity. This is the Debt: Equity ratio. It is stated as a decimal. Multiply the decimal by 100 to get the Debt: Equity percent. List it here. Evaluation: In the space below, evaluate the debt situation for each company. In your opinion, is either company carrying too much debt? Explain your answer fully. This should be at least 100 words. Net Profit Margin AXP DFS 2017: 2017: Click on the Key Ratios tab, then Full Key Ratios Data. Scroll down 2018: 2018: 2019: 2019: 2020: 2020: the page and look up the net margin (under profitability) for the past few years. These are % so put the % sign. 2021: 2021: TTM: TTM: Explain what net profit margin means. How is it calculated and what does it tell you? Evaluation: In the space below, evaluate the net profit margin for each company. Which company has the better profit margin? Complete the sentence for each company: "For every S1 of sales, XX cents is profit." Explain your answer in 100-150 words. ORNINGSTAR mie Dividends and Splits: AXP DES What is the Annual Dividend Per Share? $ S In this space explain in your own Net Profit Margin 2017: 2017: 2018: 2018: Click on the Key Ratios tab, then Full Key Ratios Data. Scroll down the page and look up the net margin (under profitability) for the past few years. These are %, so put the % 2019: 2019: 2020: 2020: 2021: 2021: sign. TTM: TTM: Explain what net profit margin means. How is it calculated and what does it tell you? Evaluation: In the space below, evaluate the net profit margin for each company. Which company has the better profit margin? Complete the sentence for each company: "For every $1 of sales, XX cents is profit." Explain your answer in 100-150 words. ANINGSTAR Mes Dividends and Splits: AXP DFS What is the Annual Dividend Per Share? S $ In this space explain in your own words why a company might choose not to pay a dividend to its shareholders. Click on the Split menu item on the same page. Has the company ever had a stock split. If no, put N/A If yes, list the date of the most recent split. What was the ratio for the most recent split. If an investor owned 75 shares before the split, how many would they have had after the split. Summarize the findings: If you had $5,000 to invest and these two companies where the only choices, how would you invest the money (all in one, split it up)? Explain your answer using at least four key data points from your evaluation in this assignment. Label your answer as 1., 2., 3., 4., and explain why you think each of these is important. Be very careful. Your answer should only be based on financial information that matters to an investor. AXP DFS ill T-Mobile Wi-Fi 2:46 AM Evaluation and Comparison of two f... Evaluation and Comparison of Funds Instructions: For your research, you will use www.morningstar.com (search for fund symbol) Both options seek growth through exposure in the U.S. Stock Market. In your analysis you will decide which option is best for the stock portion of your investment portfolio. Assume you have $3,000 to invest. Fund Name Vanguard Explorer Inv. Bridgeway Small-Cap Value VEXPX BRSVX Fund Symbol Investment Style Total Assets of the Fund y Minimum Initial Investment ( b The focus of this fund is investment in what size companies? Fund Expenses & Fees (Pri Does the fund have a front load? Does the fund have a redemption or deferred Load? Net Expense Ratio the, on Quate page listed expense rates % Analysis point: For each fund, on a $3,000 investment, how much of your money will go to expenses each year? (show the math) Diversification Pr % US Stock % US Stock The asset allocation chart shows the percent of fund money invested in different types of securities. What percent is invested in U.S. quity? How many different Equity Holdings does the fand include quity (stock) holdings #eputy (sck) holdings Port to the scroll down to Holdings List the fund's five largest holdings Company Name and the portfolio weight of each Annual Turnover rate 45% What does turnover mean? Which and has the most desirable umover? Be detailed in your answer. Fund Symbol VEXPX Fund Management People a Date of fand inception OF 00 To Do Dashboard 199 Calendar 23 % Company Name 773% 91% BRSVX Notifications Inbox T-Mobile Wi-Fi 2:46 AM Evaluation and Comparison of two f... 91% Annual Turnover rate What does turnover mean? Which and has the most desirable urnover? Be detailed in your answer. Fund Symbol VEXPX BRSVX Fund Management (People) Date of fand inception How many managers run the fund? What is the average temure and the Jongest tenure of the fund managers? Fund Performance On Morningstar.com click on the performance tab, scroll down to trailing returns Look at the total return % for the investment for each time frame, the numbers are percentages Fund performance over last 3 years Fund performance over last 5 years % Fund performance over last 10 years Fund performance over last 15 years Analysis point: Which find has the better performance over the past 3, 5, 10 & 15 years? Note: each percentage is an verge per year over the ghe number of years) Not Mongstar Performance fons, expressed in percentage terms are determined by taking the change in price ng applicable, all income and capital gas distribut during the period and devading by the starting price Unless otherwise noted Morning does not adjust total returns for sales cherges (such as front-end loads defend and redemption fees, preferring to give a clearer picture of performance Total returns de account for the expense asis, which includes management, administrative, 126-1 fees and other costs that are taken set of aout Thes, tive hos, and 15-year tet Net Asset Value (Quate tab) Net Asset Value do not lost soal asset TTM aling ve month Yield Analysis point: Explain why these two funds have a relatively low yield compared to other funds Based on the above information, explain which of these two funds would best help you achieve your investment goals? Explain your answer IN DETAIL. here using at least four pieces of information from above to justify your answer. Number your answers 1, 2, 3, and 4 You should have a short paragraph for each of the four, explaining why each piece of information is important for your decision. 23 Dashboard Calendar Notifications Inbox 773% OF DE To Do Evaluation and Comparison of Funds Instructions: For your research, you will use www.morningstar.com (search for fund symbol) Both options seek growth through exposure in the U.S. Stock Market. In your analysis you will decide which option is best for the stock portion of your investment portfolio. Assume you have $3,000 to invest. Fund Name Vanguard Explorer Inv. Bridgeway Small-Cap Value VEXPX BRSVX Fund Symbol Investment Style Total Assets of the Fund Quote tab) Minimum Initial Investment (Quote aby The focus of this fund is investm in what size companies? Fund Expenses & Fees (Price tab) Does the fund have a front load? Does the fund have a redemption or deferred Load? Net Expense Ratio % Also, on Quote page listed as adj. expense ratio) Analysis point: For each fund, on a $3,000 investment, how much of your money will go to expenses each year? (show the math) %US Stock Diversification (Portfolio tab) The asset allocation chart shows the percent of fund money invested in different types of securities. What percent is invested in U.S. equity? How many different Equity Holdings does the fund include? #equity (stock) holdings (Portfolio tab, then scroll down to Holdings) List the fund's five largest holdings Company Name and the portfolio weight of each: Annual Turnover rate 45% What does turnover mean? Which fund has the most desirable turnover? Be detailed in your answer. Fund Symbol VEXPX Fund Management (People tab) % % US Stock e equity (stock) holdings % Company Name 91% BRSVX What does turnover mean? Which fund has the most desirable turnover? Be detailed in your answer. Fund Symbol VEXPX BRSVX Fund Management (People tab) Date of fund inception How many managers run the fund? What is the average tenure and the longest tenure of the fund managers? Fund Performance (On Morningstar.com click on the performance tab, scroll down to trailing returns. Look at the total return % for the investment for each time frame, the numbers are percentages) Fund performance over last 3 years % % % Fund performance over last 5 years Fund performance over last 10 years Fund performance over last 15 years Analysis point: Which fund has the better performance over the past 3, 5, 10 & 15 years? (Note: each percentage is an average per year over the given number of years) Note: Morningstar Performance figures, expressed in percentage terms, are determined by taking the change in price, reinvesting, if applicable, all income and capital gains distributions during the period, and dividing by the starting price. Unless otherwise noted, Morningstar does not adjust total returns for sales charges fnach as front-end loads, deferred loads, and redemption fees), preferring to give a clearer picture of performance. Total returns de account for the expense ratio, which includes management, administrative, 12b-1 fees and other costs that are taken out of assets. Three, five. ten, and 15-year returns are annualized. Net Asset Value (Quote tab) Net Asset Value S (do not list total assets) % TTM (trailing twelve month) Yield Analysis point: Explain why these two funds have a relatively low yield compared to other funds. Based on the above information, explain which of these two funds would best help you achieve your investment goals? Explain your answer IN DETAIL here using at least four pieces of information from above to justify your answer. Number your answers 1, 2, 3, and 4. You should have a short paragraph for each of the four, explaining why each piece of information is important for your decision