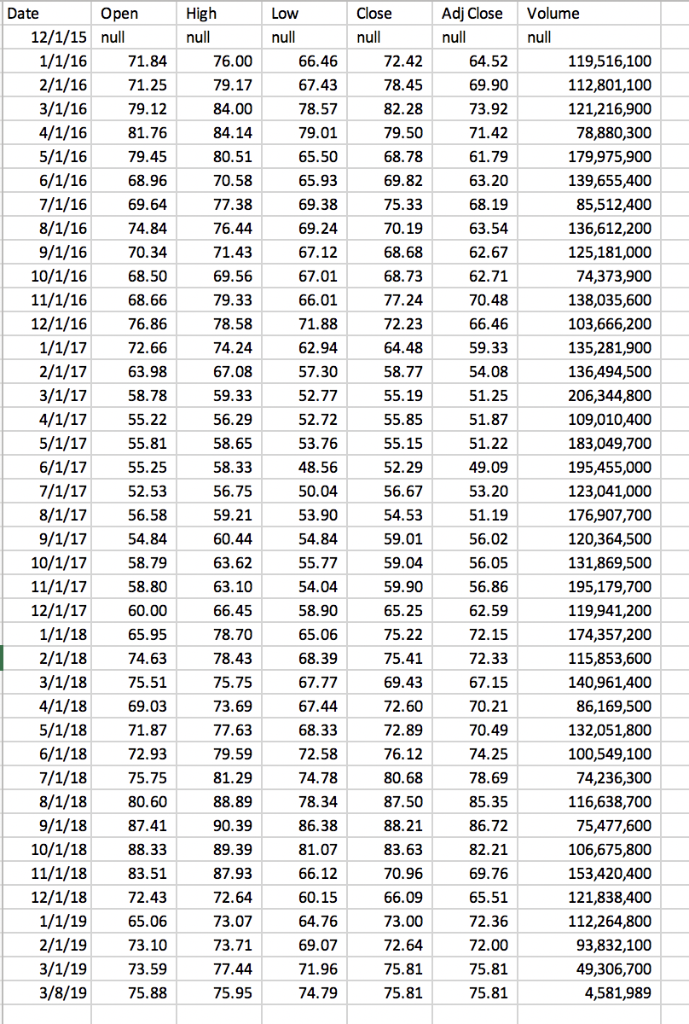
Stock Price History:
Need to find out Ratio Sheet below and their questions.
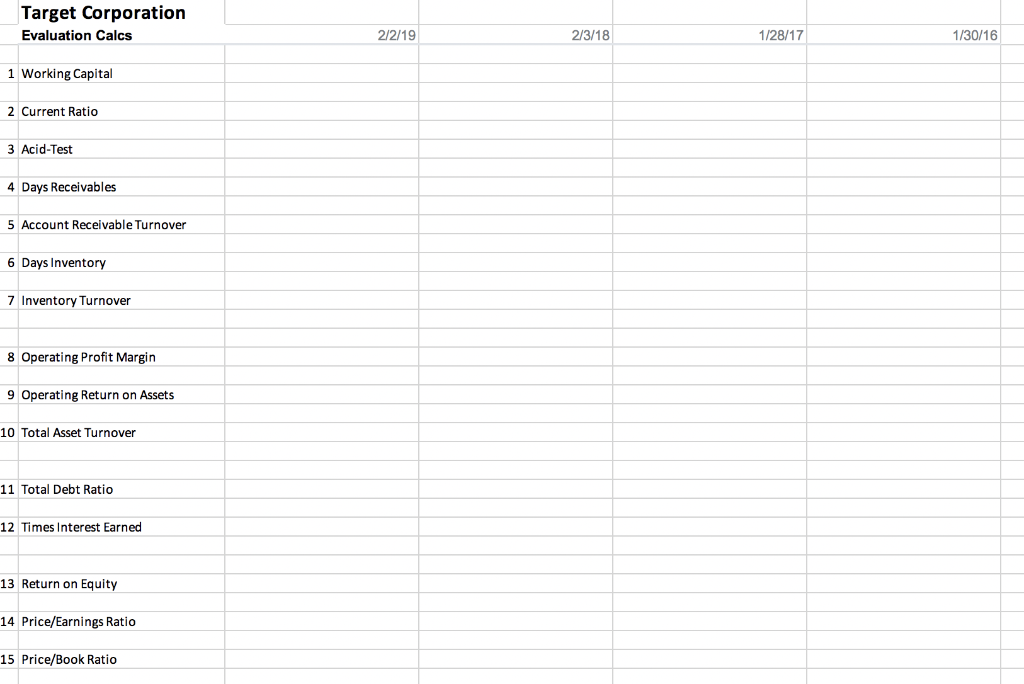
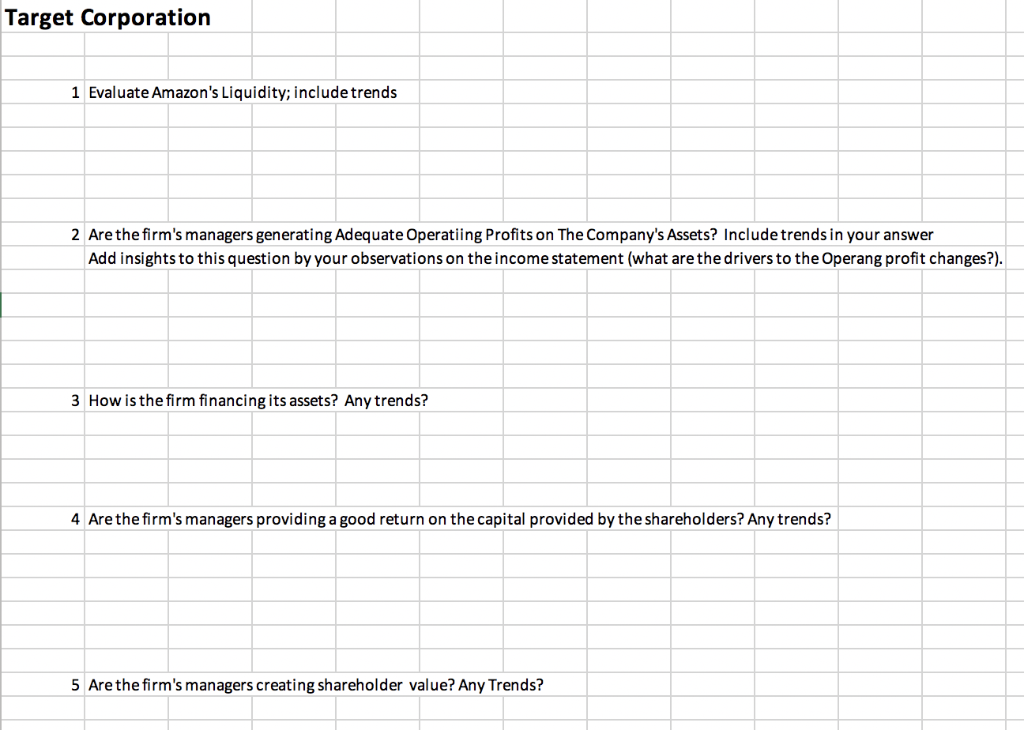
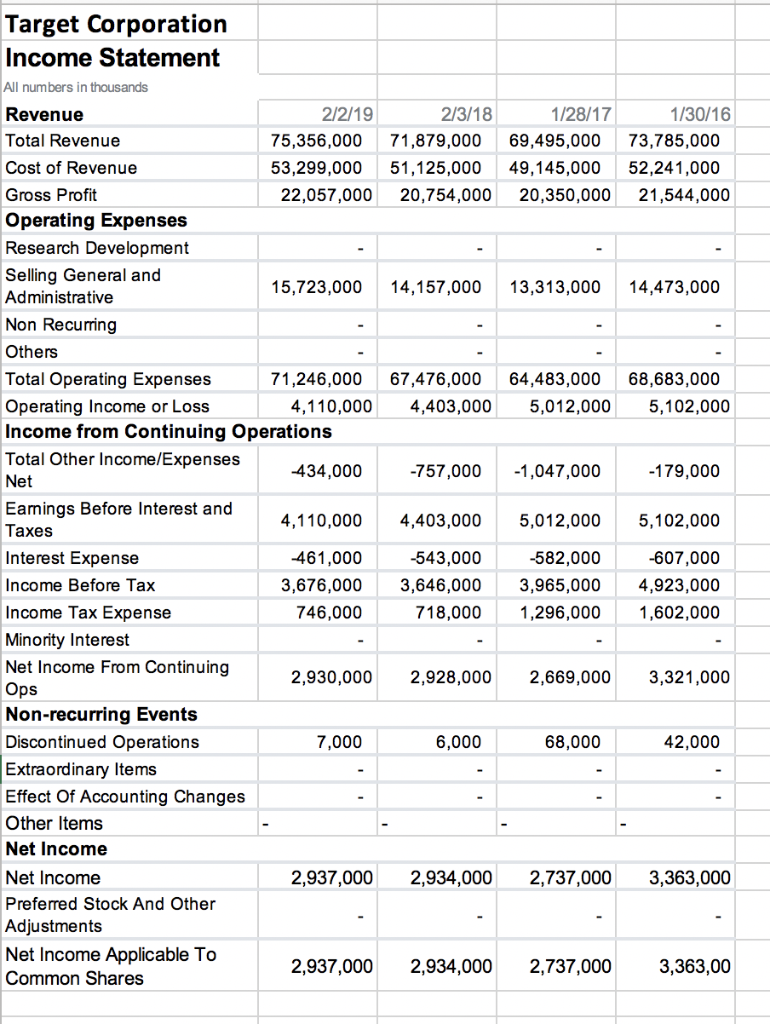
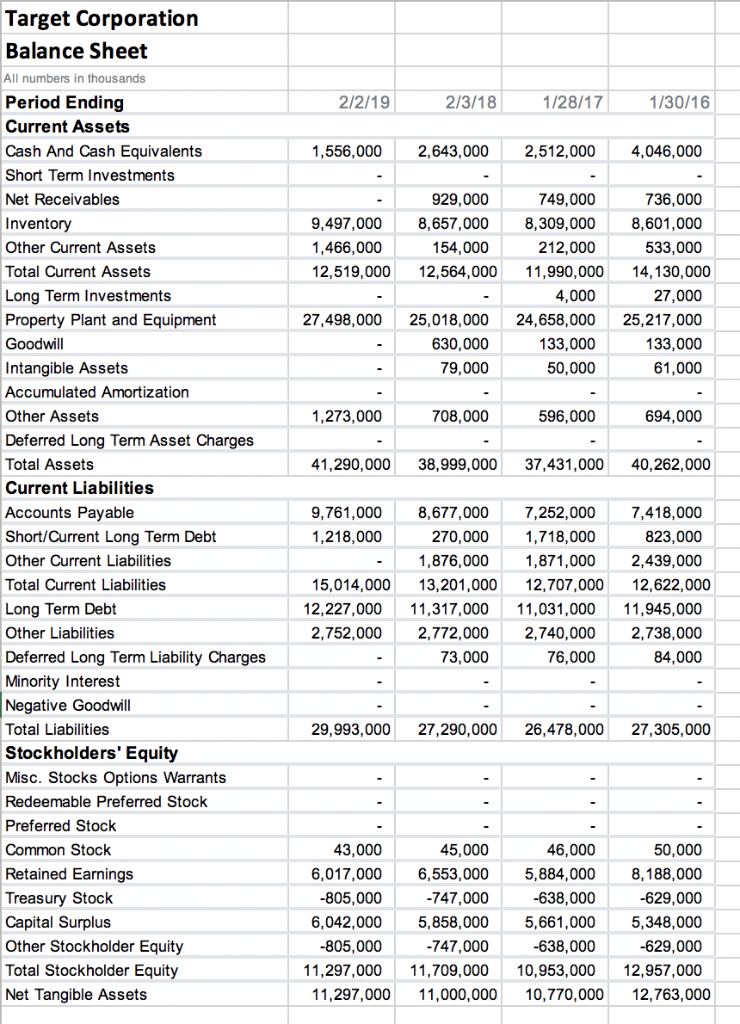
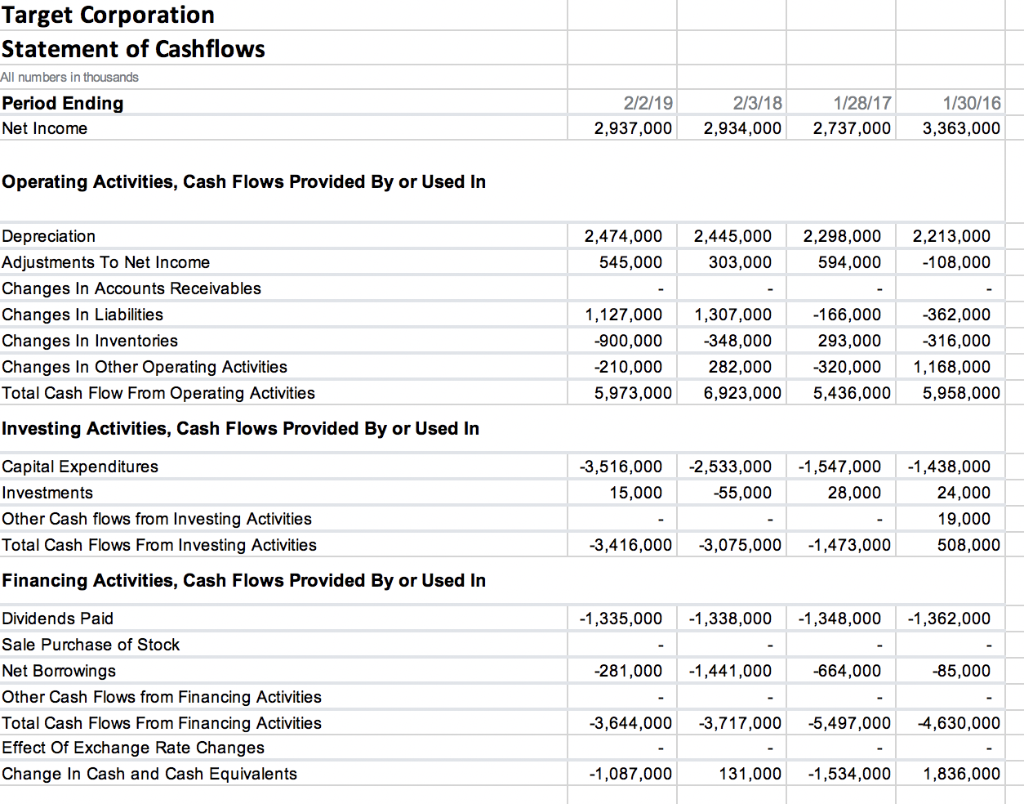
Target Corporation Income Statement All numbers in thousands Revenue Total Revenue Cost of Revenue Gross Profit Operating Expenses Research Development Selling General and Administrative Non Recurring Others Total Operating Expenses Operating Income or Loss Income from Continuing Operations Total Other Income/Expense:s Net Eamings Before Interest and Taxes Interest Expense Income Before Tax Income Tax Expense Minority Interest Net Income From Continuing Ops Non-recurring Events Discontinued Operations Extraordinary Items Effect Of Accounting Changes Other Items Net Income Net Income Preferred Stock And Other Adjustments Net Income Applicable To Common Shares 2/2/19 2/3/18 1/28/17 1/30/16 75,356,000 71,879,000 69,495,00073,785,000 53,299,000 51,125,00049,145,000 52,241,000 22,057,000 20,754,000 20,350,000 21,544,000 15,723,000 14,157,000 13,313,000 14,473,000 71,246,000 67,476,000 64,483,00068,683,000 4,110,000 4,403,000 5,012,000 5,102,000 434,000 757,000 1,047,000 179,000 4,110,000 4,403,000 5,012,000 5,102,000 -607,000 3,676,0003,646,0003,965,0004,923,000 718,0001,296,000 1,602,000 461,000 -543,000 582,000 746,000 2,930,0002,928,000 2,669,0003,321,000 7,000 6,000 68,000 42,000 2,937,000 2,934,0002,737,0003,363,000 2,937,000 2,934,000 2,737,000 3,363,00 Target Corporation Balance Sheet All numbers in thousands Period Ending Current Assets Cash And Cash Equivalents Short Term Investments Net Receivables Inventory Other Current Assets Total Current Assets Long Term Investments Property Plant and Equipment 2/2/19 2/3/18 1/28/17 1/30/16 1,556,000 2,643,0002,512,000 4,046,000 736,000 9,497,000 8,657,000 8,309,0008,601,000 533,000 929,000 749,000 1,466,000 12,519,000 12,564,000 11,990,000 14,130,000 154,000 212,000 4,000 27,000 27,498,000 25,018,000 24,658,000 25,217,000 133,000 61,000 630,000 79,000 133,000 50,000 Intangible Assets Accumulated Amortization Other Assets Deferred Long Term Asset Charges Total Assets Current Liabilities Accounts Payable Short/Current Long Term Debt Other Current Liabilities Total Current Liabilities Long Term Debt Other Liabilities Deferred Long Term Liability Charges Minority Interest Negative Goodwill Total Liabilities Stockholders' Equity Misc. Stocks Options Warrants Redeemable Preferred Stock Preferred Stock Common Stock Retained Earnings Treasury Stock Capital Surplus Other Stockholder Equity Total Stockholder Equity Net Tangible Assets 1,273,000 41,290,000 38,999,000 37,431,00040,262,000 9,761,000 8,677 708,000 596,000 694,000 2,000 7,418,000 823,000 -1,876,0001,871,0002,439,000 0007,25 270,000 1,718,000 1,218,000 15,014,000 13,201,000 12,707,00012,622,000 12,227,000 11,317,000 11,031,000 11,945,000 2,752,000 2,772,000 2,740,000 2,738,000 84,000 73,000 76,000 29,993,000 27,290,000 26,478,00027,305,000 46,000 50,000 6,017,000 6,553,000 5,884,0008,188,000 -629,000 5,348,000 -629,000 11,297,000 11,709,000 10,953,00012,957,000 45,000 -638,000 6,042,000 5,858,000 5,661,000 -638,000 805,000 -747,000 805,000 -747,000 11,297,000 11,000,000 10,770,000 12,763,000 Target Corporation Statement of Cashflows All numbers in thousands Period Ending Net Income 1/30/16 2,937,000 2,934,000 2,737,0003,363,000 2/2/19 2/3/18 1/28/17 Operating Activities, Cash Flows Provided By or Used In Depreciation Adjustments To Net Income Changes In Accounts Receivables Changes In Liabilities Changes In Inventories Changes In Other Operating Activities Total Cash Flow From Operating Activities Investing Activities, Cash Flows Provided By or Used In 2,474,000 2,445,0002,298,0002,213,000 -108,000 545,000 303,000 594,000 1,127,000 1,307,000 348,000 282,000 -900,000 -210,000 5,973,000 6,923,000 5,436,0005,958,000 166,000 293,000 362,000 -316,000 320,000 1,168,000 Capital Expenditures Investments Other Cash flows from Investing Activities Total Cash Flows From Investing Activities Financing Activities, Cash Flows Provided By or Used In Dividends Paid Sale Purchase of Stock Net Borrowings Other Cash Flows from Financing Activities Total Cash Flows From Financing Activities Effect Of Exchange Rate Changes Change In Cash and Cash Equivalents 3,516,000 2,533,0001,547,0001,438,000 15,000 -55,000 28,000 24,000 19,000 508,000 3,416,000 3,075,000 1,473,000 1,335,000 1,338,000 1,348,000-1,362,000 281,000-1,441,000 -664,000 85,000 3,644,000-3,717,000-5,497,000-4,630,000 1,087,000 131,0001,534,000 1,836,000 Target Corporation Evaluation Calcs 2/2/19 2/3/18 1/28/17 1/30/16 1 Working Capital 2 Current Ratio 3 Acid-Test 4 Days Receivables 5 Account Receivable Turnover 6 Days Inventory 7 Inventory Turnover 8 Operating Profit Margin 9 Operating Return on Assets 10 Total Asset Turnover 11 Total Debt Ratio 12 Times Interest Earnec 13 Return on Equity 14 Price/Earnings Ratio 15 Price/Book Ratio Target Corporation 1 Evaluate Amazon's Liquidity; include trends 2 Are the firm's managers generating Adequate Operatiing Profits on The Company's Assets? Include trends in your answer Add insights to this question by your observations on the income statement (what are the drivers to the Operang profit changes?). 3 How is the firm financing its assets? Any trends? 4 Are the firm's managers providing a good return on the capital provided by the shareholders? Any trends? 5 Are the firm's managereating shareholder value? Any Trends? Target Corporation Income Statement All numbers in thousands Revenue Total Revenue Cost of Revenue Gross Profit Operating Expenses Research Development Selling General and Administrative Non Recurring Others Total Operating Expenses Operating Income or Loss Income from Continuing Operations Total Other Income/Expense:s Net Eamings Before Interest and Taxes Interest Expense Income Before Tax Income Tax Expense Minority Interest Net Income From Continuing Ops Non-recurring Events Discontinued Operations Extraordinary Items Effect Of Accounting Changes Other Items Net Income Net Income Preferred Stock And Other Adjustments Net Income Applicable To Common Shares 2/2/19 2/3/18 1/28/17 1/30/16 75,356,000 71,879,000 69,495,00073,785,000 53,299,000 51,125,00049,145,000 52,241,000 22,057,000 20,754,000 20,350,000 21,544,000 15,723,000 14,157,000 13,313,000 14,473,000 71,246,000 67,476,000 64,483,00068,683,000 4,110,000 4,403,000 5,012,000 5,102,000 434,000 757,000 1,047,000 179,000 4,110,000 4,403,000 5,012,000 5,102,000 -607,000 3,676,0003,646,0003,965,0004,923,000 718,0001,296,000 1,602,000 461,000 -543,000 582,000 746,000 2,930,0002,928,000 2,669,0003,321,000 7,000 6,000 68,000 42,000 2,937,000 2,934,0002,737,0003,363,000 2,937,000 2,934,000 2,737,000 3,363,00 Target Corporation Balance Sheet All numbers in thousands Period Ending Current Assets Cash And Cash Equivalents Short Term Investments Net Receivables Inventory Other Current Assets Total Current Assets Long Term Investments Property Plant and Equipment 2/2/19 2/3/18 1/28/17 1/30/16 1,556,000 2,643,0002,512,000 4,046,000 736,000 9,497,000 8,657,000 8,309,0008,601,000 533,000 929,000 749,000 1,466,000 12,519,000 12,564,000 11,990,000 14,130,000 154,000 212,000 4,000 27,000 27,498,000 25,018,000 24,658,000 25,217,000 133,000 61,000 630,000 79,000 133,000 50,000 Intangible Assets Accumulated Amortization Other Assets Deferred Long Term Asset Charges Total Assets Current Liabilities Accounts Payable Short/Current Long Term Debt Other Current Liabilities Total Current Liabilities Long Term Debt Other Liabilities Deferred Long Term Liability Charges Minority Interest Negative Goodwill Total Liabilities Stockholders' Equity Misc. Stocks Options Warrants Redeemable Preferred Stock Preferred Stock Common Stock Retained Earnings Treasury Stock Capital Surplus Other Stockholder Equity Total Stockholder Equity Net Tangible Assets 1,273,000 41,290,000 38,999,000 37,431,00040,262,000 9,761,000 8,677 708,000 596,000 694,000 2,000 7,418,000 823,000 -1,876,0001,871,0002,439,000 0007,25 270,000 1,718,000 1,218,000 15,014,000 13,201,000 12,707,00012,622,000 12,227,000 11,317,000 11,031,000 11,945,000 2,752,000 2,772,000 2,740,000 2,738,000 84,000 73,000 76,000 29,993,000 27,290,000 26,478,00027,305,000 46,000 50,000 6,017,000 6,553,000 5,884,0008,188,000 -629,000 5,348,000 -629,000 11,297,000 11,709,000 10,953,00012,957,000 45,000 -638,000 6,042,000 5,858,000 5,661,000 -638,000 805,000 -747,000 805,000 -747,000 11,297,000 11,000,000 10,770,000 12,763,000 Target Corporation Statement of Cashflows All numbers in thousands Period Ending Net Income 1/30/16 2,937,000 2,934,000 2,737,0003,363,000 2/2/19 2/3/18 1/28/17 Operating Activities, Cash Flows Provided By or Used In Depreciation Adjustments To Net Income Changes In Accounts Receivables Changes In Liabilities Changes In Inventories Changes In Other Operating Activities Total Cash Flow From Operating Activities Investing Activities, Cash Flows Provided By or Used In 2,474,000 2,445,0002,298,0002,213,000 -108,000 545,000 303,000 594,000 1,127,000 1,307,000 348,000 282,000 -900,000 -210,000 5,973,000 6,923,000 5,436,0005,958,000 166,000 293,000 362,000 -316,000 320,000 1,168,000 Capital Expenditures Investments Other Cash flows from Investing Activities Total Cash Flows From Investing Activities Financing Activities, Cash Flows Provided By or Used In Dividends Paid Sale Purchase of Stock Net Borrowings Other Cash Flows from Financing Activities Total Cash Flows From Financing Activities Effect Of Exchange Rate Changes Change In Cash and Cash Equivalents 3,516,000 2,533,0001,547,0001,438,000 15,000 -55,000 28,000 24,000 19,000 508,000 3,416,000 3,075,000 1,473,000 1,335,000 1,338,000 1,348,000-1,362,000 281,000-1,441,000 -664,000 85,000 3,644,000-3,717,000-5,497,000-4,630,000 1,087,000 131,0001,534,000 1,836,000 Target Corporation Evaluation Calcs 2/2/19 2/3/18 1/28/17 1/30/16 1 Working Capital 2 Current Ratio 3 Acid-Test 4 Days Receivables 5 Account Receivable Turnover 6 Days Inventory 7 Inventory Turnover 8 Operating Profit Margin 9 Operating Return on Assets 10 Total Asset Turnover 11 Total Debt Ratio 12 Times Interest Earnec 13 Return on Equity 14 Price/Earnings Ratio 15 Price/Book Ratio Target Corporation 1 Evaluate Amazon's Liquidity; include trends 2 Are the firm's managers generating Adequate Operatiing Profits on The Company's Assets? Include trends in your answer Add insights to this question by your observations on the income statement (what are the drivers to the Operang profit changes?). 3 How is the firm financing its assets? Any trends? 4 Are the firm's managers providing a good return on the capital provided by the shareholders? Any trends? 5 Are the firm's managereating shareholder value? Any Trends