

Answered step by step
Verified Expert Solution
Question
1 Approved Answer
Stock Trading Simulation Create a form, using the Stock Trading.xlsm file that performs the following actions: Allows the user to choose different amounts of Initial
Stock Trading Simulation
Create a form, using the Stock Trading.xlsm file that performs the following actions:
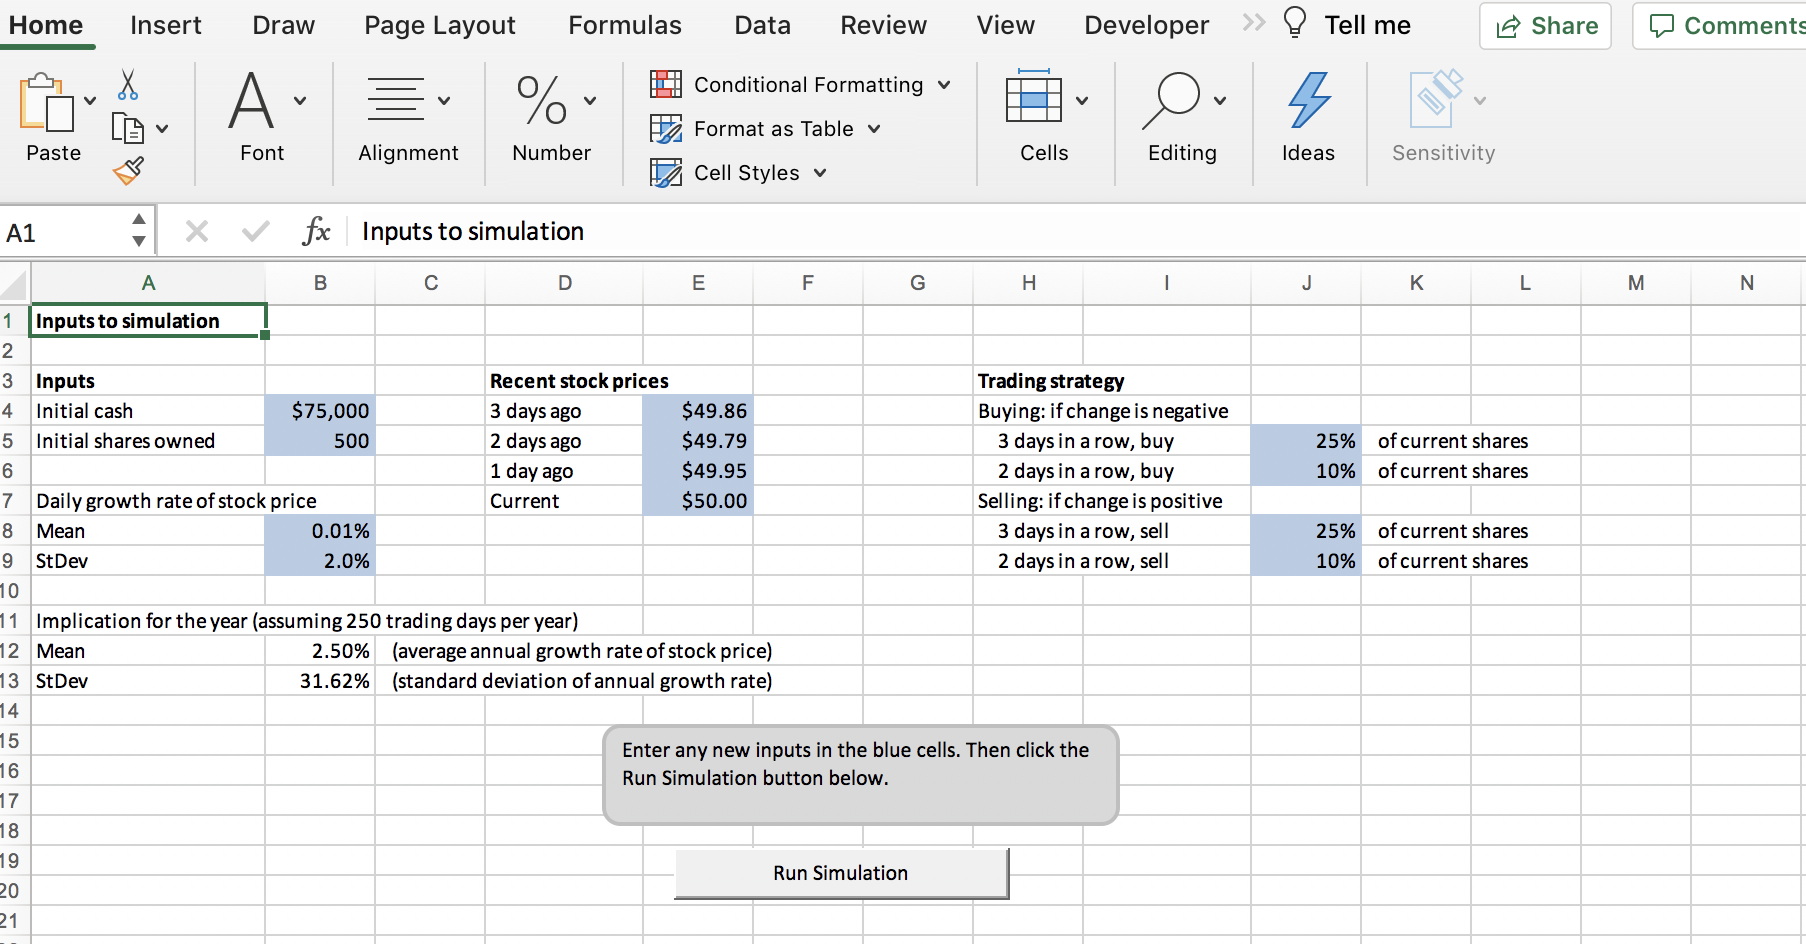
- Allows the user to choose different amounts of Initial Cash (decide if you want this to be an input, a set of pre-defined options, or a list)
- Allows the user to choose different amounts of Initial Shares owned (decide if you want this to be an input, a set of pre-defined options, or a list)
- Allows the user to pick between different daily growth rate means that you have pre-defined. This range should be meaningful.
- Allows the user to pick between different daily growth rate StDev that you have pre-defined. This range should be meaningful.
- Allows the user to pick between a set of different recent stock prices that you pre-defined
- Allows the user to pick between three different trading strategies, conservative, moderate, and aggressive, which you define, and can be different for buying and selling.
- Allow the user to pick how many simulations to run. These should all be on a form, or multiple forms, not using input boxes.
Please help with this problem.
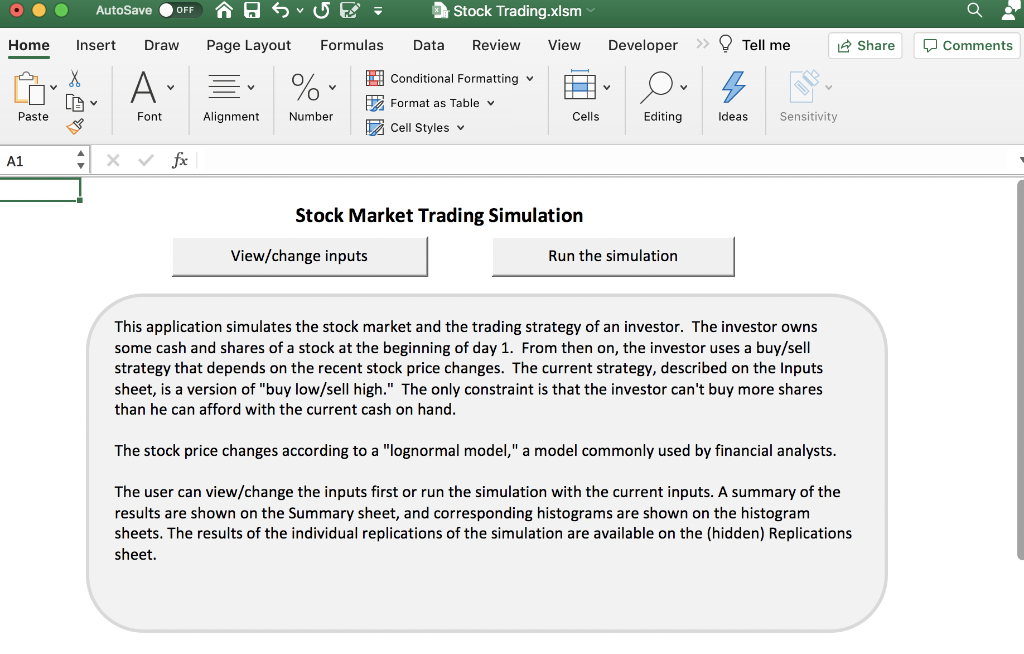
Home Insert Draw Page Layout Formulas Data Review View Developer Tell me Share Comments Conditional Formatting V A. % V o 3 V Format as Table v Paste Font Alignment Number Cells Editing Ideas Sensitivity NB Cell Styles A1 fx Inputs to simulation A B C D E F G - J K L M N 25% of current shares 10% of current shares 1 Inputs to simulation 2 3 Inputs Recent stock prices Trading strategy 4 Initial cash $75,000 3 days ago $49.86 Buying: if change is negative 5 Initial shares owned 500 2 days ago $49.79 3 days in a row, buy 6 1 day ago $49.95 2 days in a row, buy 7 Daily growth rate of stock price Current $50.00 Selling: if change is positive 8 Mean 0.01% 3 days in a row, sell 9 StDev 2.0% 2 days in a row, sell 10 11 Implication for the year (assuming 250 trading days per year) 12 Mean 2.50% (average annual growth rate of stock price) 13 St Dev 31.62% (standard deviation of annual growth rate) 14 15 Enter any new inputs in the blue cells. Then click the 16 Run Simulation button below. 17 25% of current shares 10% of current shares 18 19 Run Simulation 20 21 AutoSave OFF OSUE= Stock Trading.xlsm Q Home Insert Draw Page Layout Formulas Data Review View Developer >> Tell me Share o Comments Conditional Formatting y A LE % + v 3 1 Paste Font Alignment Number Format as Table Cell Styles Cells Editing Ideas Sensitivity A1 x fx Stock Market Trading Simulation View/change inputs Run the simulation This application simulates the stock market and the trading strategy of an investor. The investor owns some cash and shares of a stock at the beginning of day 1. From then on, the investor uses a buy/sell strategy that depends on the recent stock price changes. The current strategy, described on the Inputs sheet, is a version of "buy low/sell high." The only constraint is that the investor can't buy more shares than he can afford with the current cash on hand. The stock price changes according to a "lognormal model," a model commonly used by financial analysts. The user can view/change the inputs first or run the simulation with the current inputs. A summary of the results are shown on the Summary sheet, and corresponding histograms are shown on the histogram sheets. The results of the individual replications of the simulation are available on the (hidden) Replications sheet. Home Insert Draw Page Layout Formulas Data Review View Developer Tell me Share Comments Conditional Formatting V A. % V o 3 V Format as Table v Paste Font Alignment Number Cells Editing Ideas Sensitivity NB Cell Styles A1 fx Inputs to simulation A B C D E F G - J K L M N 25% of current shares 10% of current shares 1 Inputs to simulation 2 3 Inputs Recent stock prices Trading strategy 4 Initial cash $75,000 3 days ago $49.86 Buying: if change is negative 5 Initial shares owned 500 2 days ago $49.79 3 days in a row, buy 6 1 day ago $49.95 2 days in a row, buy 7 Daily growth rate of stock price Current $50.00 Selling: if change is positive 8 Mean 0.01% 3 days in a row, sell 9 StDev 2.0% 2 days in a row, sell 10 11 Implication for the year (assuming 250 trading days per year) 12 Mean 2.50% (average annual growth rate of stock price) 13 St Dev 31.62% (standard deviation of annual growth rate) 14 15 Enter any new inputs in the blue cells. Then click the 16 Run Simulation button below. 17 25% of current shares 10% of current shares 18 19 Run Simulation 20 21 AutoSave OFF OSUE= Stock Trading.xlsm Q Home Insert Draw Page Layout Formulas Data Review View Developer >> Tell me Share o Comments Conditional Formatting y A LE % + v 3 1 Paste Font Alignment Number Format as Table Cell Styles Cells Editing Ideas Sensitivity A1 x fx Stock Market Trading Simulation View/change inputs Run the simulation This application simulates the stock market and the trading strategy of an investor. The investor owns some cash and shares of a stock at the beginning of day 1. From then on, the investor uses a buy/sell strategy that depends on the recent stock price changes. The current strategy, described on the Inputs sheet, is a version of "buy low/sell high." The only constraint is that the investor can't buy more shares than he can afford with the current cash on hand. The stock price changes according to a "lognormal model," a model commonly used by financial analysts. The user can view/change the inputs first or run the simulation with the current inputs. A summary of the results are shown on the Summary sheet, and corresponding histograms are shown on the histogram sheets. The results of the individual replications of the simulation are available on the (hidden) Replications sheet
Step by Step Solution
There are 3 Steps involved in it
Step: 1

Get Instant Access to Expert-Tailored Solutions
See step-by-step solutions with expert insights and AI powered tools for academic success
Step: 2

Step: 3
Ace Your Homework with AI
Get the answers you need in no time with our AI-driven, step-by-step assistance
Get Started
The Business Strategy Audit
Authors: Vernal Della-Piana, Murray Low, Kendall Lyman
1st Edition
978-0955970740