

Answered step by step
Verified Expert Solution
Question
1 Approved Answer
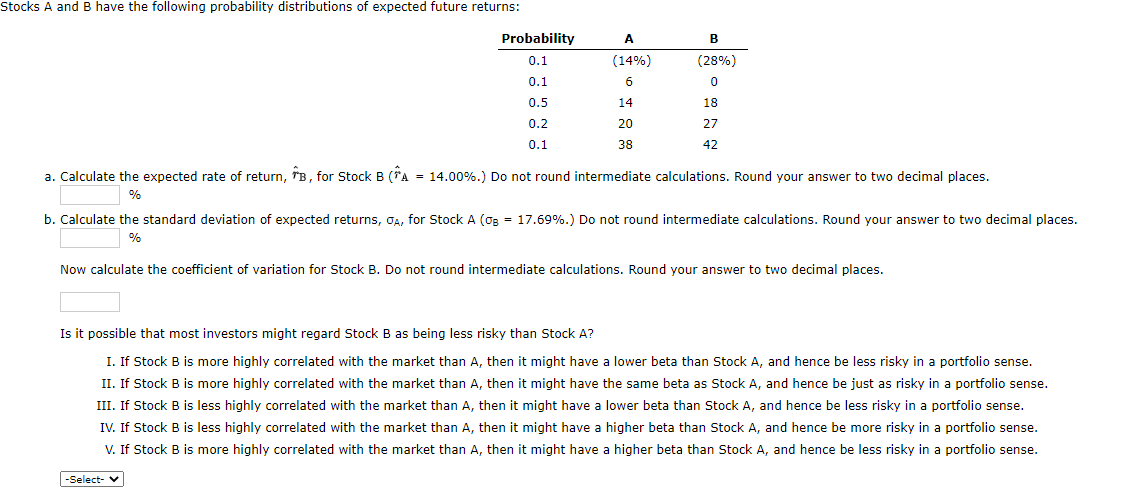
Stocks A and B have the following probability distributions of expected future returns: A B Probability 0.1 0.1 (28%) (14%) 6 0 14 18 0.5
Step by Step Solution
There are 3 Steps involved in it
Step: 1

Get Instant Access to Expert-Tailored Solutions
See step-by-step solutions with expert insights and AI powered tools for academic success
Step: 2

Step: 3
Ace Your Homework with AI
Get the answers you need in no time with our AI-driven, step-by-step assistance
Get Started
The Compensation Committee Handbook
Authors: James F. Reda, Stewart Reifler, Michael L. Stevens
4th Edition
1118370619, 978-1118370612