

Answered step by step
Verified Expert Solution
Question
1 Approved Answer
Stocks A and B have the following probability distributions of expected future returns: a. Calculate the expected rate of return, r^B, for Stock B(r^A=12.20%.) Do
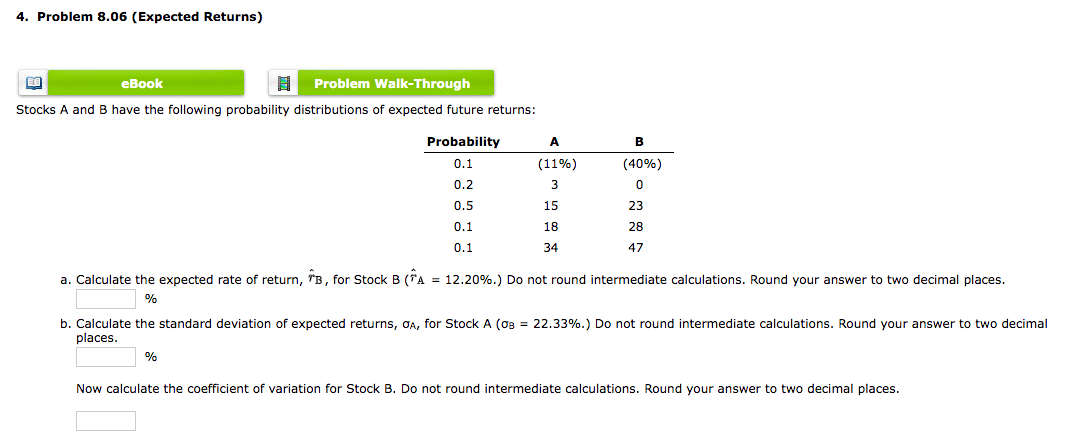
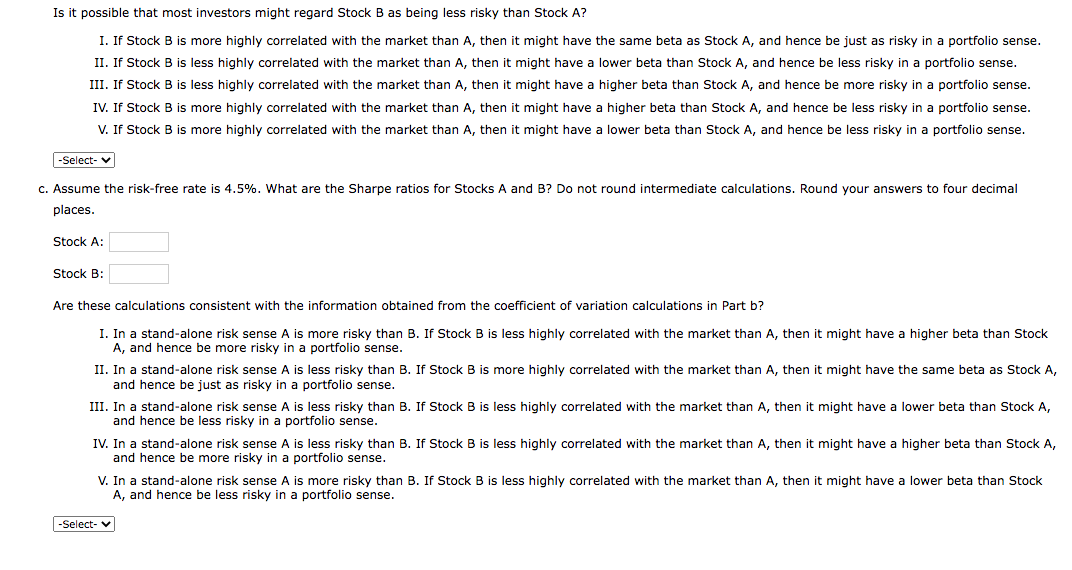 Stocks A and B have the following probability distributions of expected future returns: a. Calculate the expected rate of return, r^B, for Stock B(r^A=12.20%.) Do not round intermediate calculations. Round your answer to two decimal places. % b. Calculate the standard deviation of expected returns, A, for Stock A ( B=22.33%.) Do not round intermediate calculations. Round your answer to two decimal places. % Now calculate the coefficient of variation for Stock B. Do not round intermediate calculations. Round your answer to two decimal places. Is it possible that most investors might regard Stock B as being less risky than Stock A? I. If Stock B is more highly correlated with the market than A, then it might have the same beta as Stock A, and hence be just as risky in a portfolio sense. II. If Stock B is less highly correlated with the market than A, then it might have a lower beta than Stock A, and hence be less risky in a portfolio sense. III. If Stock B is less highly correlated with the market than A, then it might have a higher beta than Stock A, and hence be more risky in a portfolio sense. IV. If Stock B is more highly correlated with the market than A, then it might have a higher beta than Stock A, and hence be less risky in a portfolio sense. V. If Stock B is more highly correlated with the market than A, then it might have a lower beta than Stock A, and hence be less risky in a portfolio sense. c. Assume the risk-free rate is 4.5%. What are the Sharpe ratios for Stocks A and B? Do not round intermediate calculations. Round your answers to four decimal places. Stock A : Stock B: Are these calculations consistent with the information obtained from the coefficient of variation calculations in Part b? I. In a stand-alone risk sense A is more risky than B. If Stock B is less highly correlated with the market than A, then it might have a higher beta than Stock A, and hence be more risky in a portfolio sense. II. In a stand-alone risk sense A is less risky than B. If Stock B is more highly correlated with the market than A, then it might have the same beta as Stock A, and hence be just as risky in a portfolio sense. III. In a stand-alone risk sense A is less risky than B. If Stock B is less highly correlated with the market than A, then it might have a lower beta than Stock A, and hence be less risky in a portfolio sense. IV. In a stand-alone risk sense A is less risky than B. If Stock B is less highly correlated with the market than A, then it might have a higher beta than Stock A, and hence be more risky in a portfolio sense. V. In a stand-alone risk sense A is more risky than B. If Stock B is less highly correlated with the market than A, then it might have a lower beta than Stock A, and hence be less risky in a portfolio sense
 Step by Step Solution
There are 3 Steps involved in it
Step: 1

Get Instant Access to Expert-Tailored Solutions
See step-by-step solutions with expert insights and AI powered tools for academic success
Step: 2

Step: 3
Ace Your Homework with AI
Get the answers you need in no time with our AI-driven, step-by-step assistance
Get Started
Fundamentals of Financial Management
Authors: Eugene F. Brigham, Joel F. Houston
Concise 6th Edition
324664559, 978-0324664553